| July 2011 |
Running on Fumes
Part 2: State of the Investor
How much fuel is there in the U.S. economic tank currently -- and is it enough to propel us into a new secular bull market?
In the past five months, the S&P 500 has experienced a 7% decline, a 9% rally, another 7% decline and a subsequent 7% rally. As this newsletter is being written, the S&P 500 quote on our monitor currently is 1343. Five months ago, the S&P 500 closed at 1343. These past five months of sound and fury signifying nothing could be considered a microcosm of the larger-scale environment in which U.S. stocks remain mired. That is, a period of many years during which the stock market undergoes several significant swings both up and down but experiences little to no net progress over the period. This is the definition of a secular bear market.
As
we have stated many times it is our contention that, based on current
evidence and historical precedents, this bear market that started in
2000 is likely to last for the better part of the next decade as well.
Furthermore, we do not believe that any actions or events can save the
market from this fate. However, it is said that men behave wisely only
after exhausting all of the
alternatives. Therefore,
although it is our contention that we have years to go
before another
sustainable bull market begins it is in an attempt of maintaining
objectivity that
we continue our examination into the
possibility that the conditions are or
will soon be in
place to put an end to the post-2000 secular bear market and
to
enter a less risky investing environment. Specifically, in this piece,
we examine potential sources of
buying power that could provide the "fuel" needed for such a launch.
Last month in Part 1 of our study, we looked at the balance sheets of U.S. households. We found that, while they had undergone moderate repairs in recent years versus their over-leveraged, under-funded conditions at the height of the credit bubble, households are still far from being in sound financial standing -- and farther still from conditions from which the previous secular bull market was launched. This month, we look at the state of the investor to determine whether or not current investor behavior and allocation of assets is potentially indicative of the launching point of a secular bull market.
How Much Fuel?
The State of the Investor
As with Part 1, when possible we will compare present conditions with those of the corresponding period in the prior secular bear market from 1966 to 1982. Again, we always stress that it is important to look at similar periods in the market cycle when making market comparisons to get a valid and meaningful perspective. It is our contention that the human natural response to similar conditions will likewise be similar. Looking at market conditions and investor behavior during previous bear markets can shed light on what to expect during the current bear market and provide clues on what to look for as possible signs of the end of the bear.
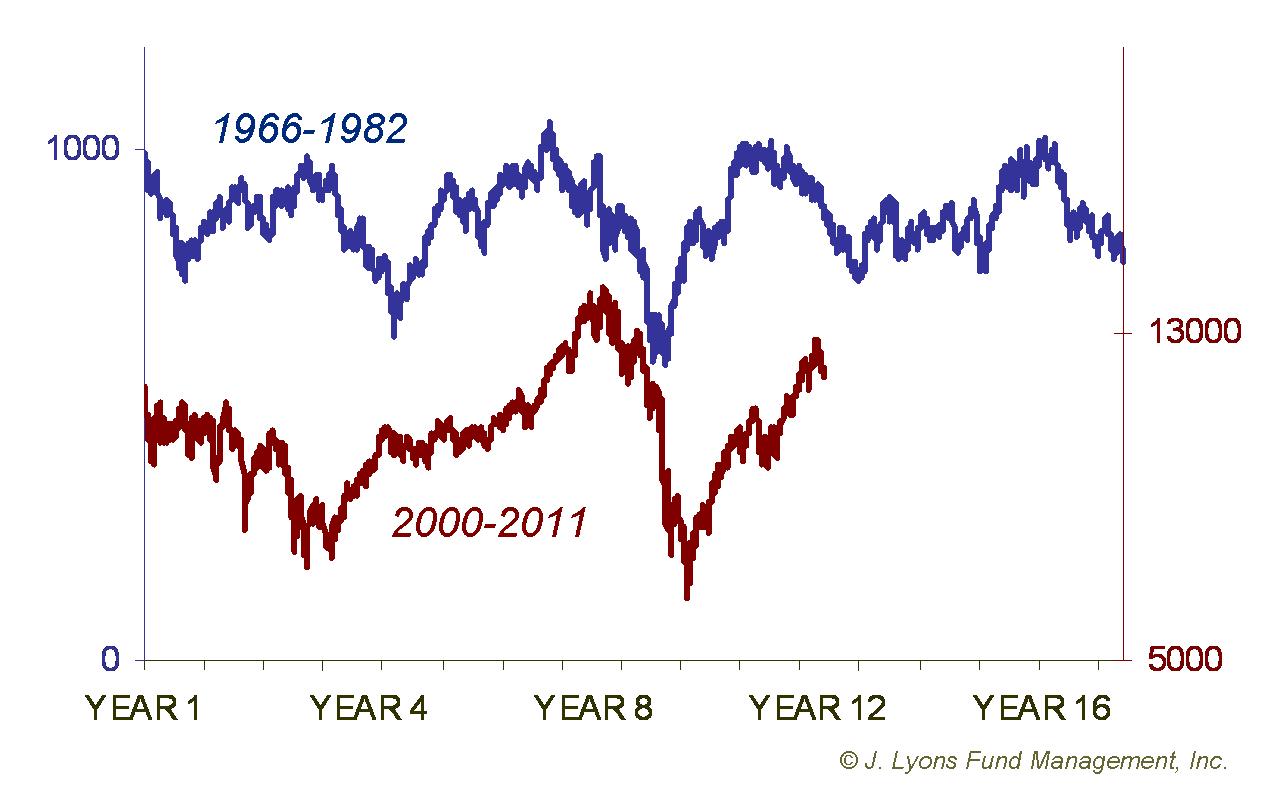
At a comparable point in the 1966-1982 secular bear market, investors still had another 5-6 years to go before a new sustainable bull market was launched. Does the current secular bear market have several more years in it as well or could the end be near? Is current investment behavior typical of the end of secular bear markets? How are investable assets positioned relative to their potential to support a new secular bull market?
Household Assets Invested in Stocks
Probably the most illustrative chart in examining secular stock cycles is the one below that shows the percentage of household assets invested in stocks. This chart reveals a lot of information not only about the level of household investments in stocks but also the psychology and behavior of investors during secular bear (and bull) markets.
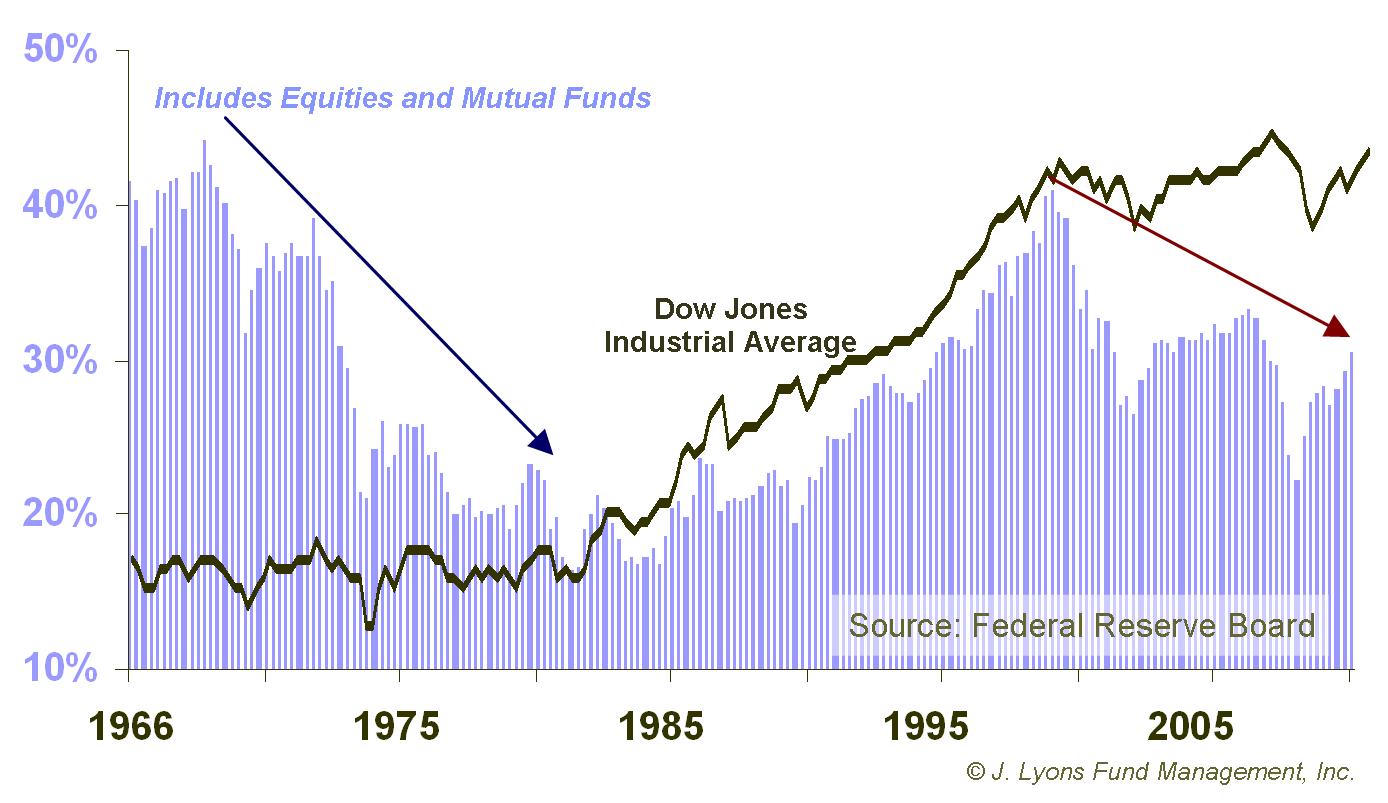
The psychological impact of human nature in investing, specifically fear and greed, is unmistakable when examining this chart. First of all, notice that peak levels of household assets invested in stocks came at the very top -- and very end -- of secular bull markets in 1966 (a slightly higher level was reached in 1970) and in 2000. This is when greed most forcefully rears its ugly head. Those who remember the dot.com and day-trading mania of 1999-2000 can likely attest to that. The most unfortunate result of having the highest level of investment at market tops is that investors lose as much money as possible as the market begins its descent.
Yes, some of the high levels of investment can simply be attributed to market appreciation. However, most of it is attributable to investor psychology, i.e., greed. As indicated by the arrows, notice that as secular bear markets progress, the level of household investment declines, even at times when the market reaches or nears previous peak levels. This is indicative of investors becoming discouraged by a vacillating market in which any gains they make are repeatedly wiped away in a subsequent decline.
It is telling, but not surprising, that the lowest percentage of household assets invested in stocks (16.3%) was recorded in the 2nd quarter of 1982. Predictably, at least in hindsight, the secular bull market began in August of 1982. Again, this was not simply a matter of market depreciation cutting into investor assets. The market had actually been some 40% lower at one point in the mid-1970's. Rather, this is evidence of the frustration and the fear component of human nature in investing. Investors were exhausted by the long, sideways market and had all but sworn off stocks by the time the bull market began in 1982. Unfortunately, having their all-time low level of stock investment in 1982 meant that households experienced an extremely low level of participation in the initial stages of that bull market. Furthermore, investors were so reluctant to embrace the new bull market that they did not achieve even the mean level of stock investment of around 30% until 1995, thirteen years after the bull market began.
To more closely compare the behavior of household stock investment in the current secular bear market with that of the previous bear, we have overlaid the data from the two periods.
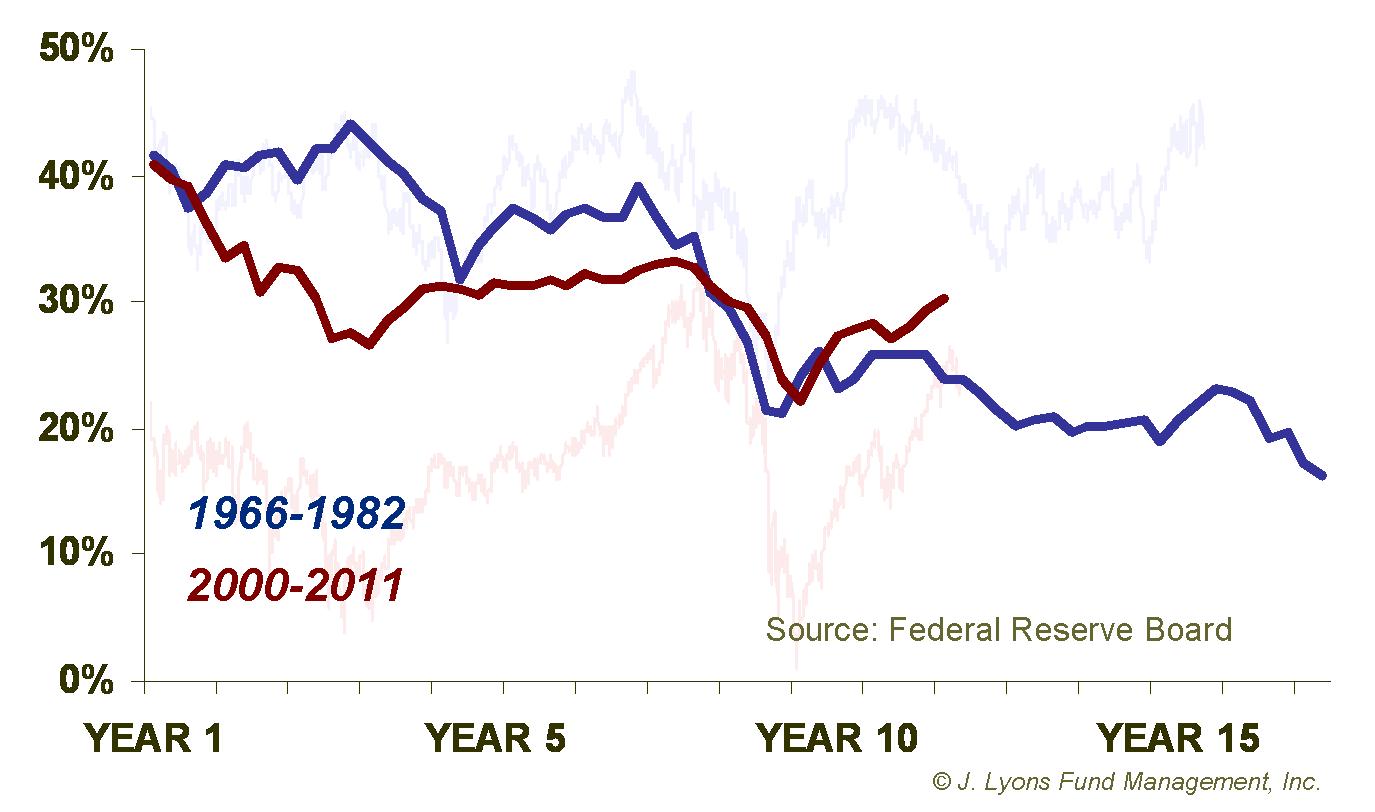
As was evident in the first chart, the trajectory of household stock investment is very similar in the current ongoing bear market to that which transpired from 1966 to 1982. As the bear market has progressed in a more or less sideways fashion, the level of household stock investment has steadily declined. Again, this is likely due to a growing number of investors "throwing in the towel" with regards to stock investing after having been burned by market declines in 2002 and 2008.
In addition to the similarity in trajectory, the actual level of household stock investment during this bear market has also closely tracked that of the 1966-82 bear market. Interestingly, the current reading is right at the long-term mean of 30%. In terms of making progress towards the start of a new secular bull market, it is a constructive sign that households have reduced their level of stock investment to the extent that they have. As we discussed last month, however, when indicators reach extreme levels during one part of the cycle, they often go to opposite extremes when the cycle turns the other direction. Therefore, we can expect that the percentage of household assets in stocks will eventually approach a level closer to the 16% range that marked the end of the last secular bear market in 1982.
It may sound counter-intuitive that having less money going into the stock market is a good thing. To be clear, as the process of households reducing their stock investment progresses, it is not a positive for the market. However, when dealing with cycle tops and bottoms, it is more important to consider the extremes. As illustrated above, households invest the most at market tops and the least at market bottoms. Therefore, from a contrarian point of view the most bullish sign possible is an extreme low level of stock investment. The reduction in stock investment during this secular bear market has therefore been a productive event toward eventually approaching the end of the bear.
At the point that an extreme low level of investment is reached, the odds are greatest that a new secular bull market can commence. The reason is perhaps that there is nobody left to sell. At that point, all of the money that was removed from the stock market can then be redeployed and support a long-term bull market. Although, like the last secular bull, the redeployment of assets into stocks will likely be slow as investors will be very distrustful of stocks at that point -- which is one reason why the conditions can support a long-term advance. We are getting a little ahead of ourselves though as the stock investment is only back to its mean level. A related issue to the public's involvement in the market as assistance to support the launching of a new long-term bull is the amount of cash outside the stock market waiting to fuel it. Let's now take a look at such sideline cash..
Investor Cash
For
sure a substantial amount of cash sitting idle outside of the stock
market could buoy stocks if and when it made its way into the market.
Also, it is easy to surmise that with the low trading volume of the
past few years that there simply must be a substantial amount of
potentially investable funds sitting in cash some place waiting to be
deployed. Fortunately there are objective measures that we can look at
in order
to make a determination.
Retail Money Market Funds
One source of cash is of course money market funds. These are risk-free (usually) accounts that pay a rate of interest on investor balances. Typically during periods of market weakness, investors will flock to these accounts for protection. And predictably, they will pour the largest amount of money into money markets at lows in the market. The Investment Company Institute reports each week on the amount of assets in money market funds held by retail investors, or non-institutional investors. If we were near a significant market low, we would expect to find a "mountain of cash" in money market funds. That isn't the case currently.
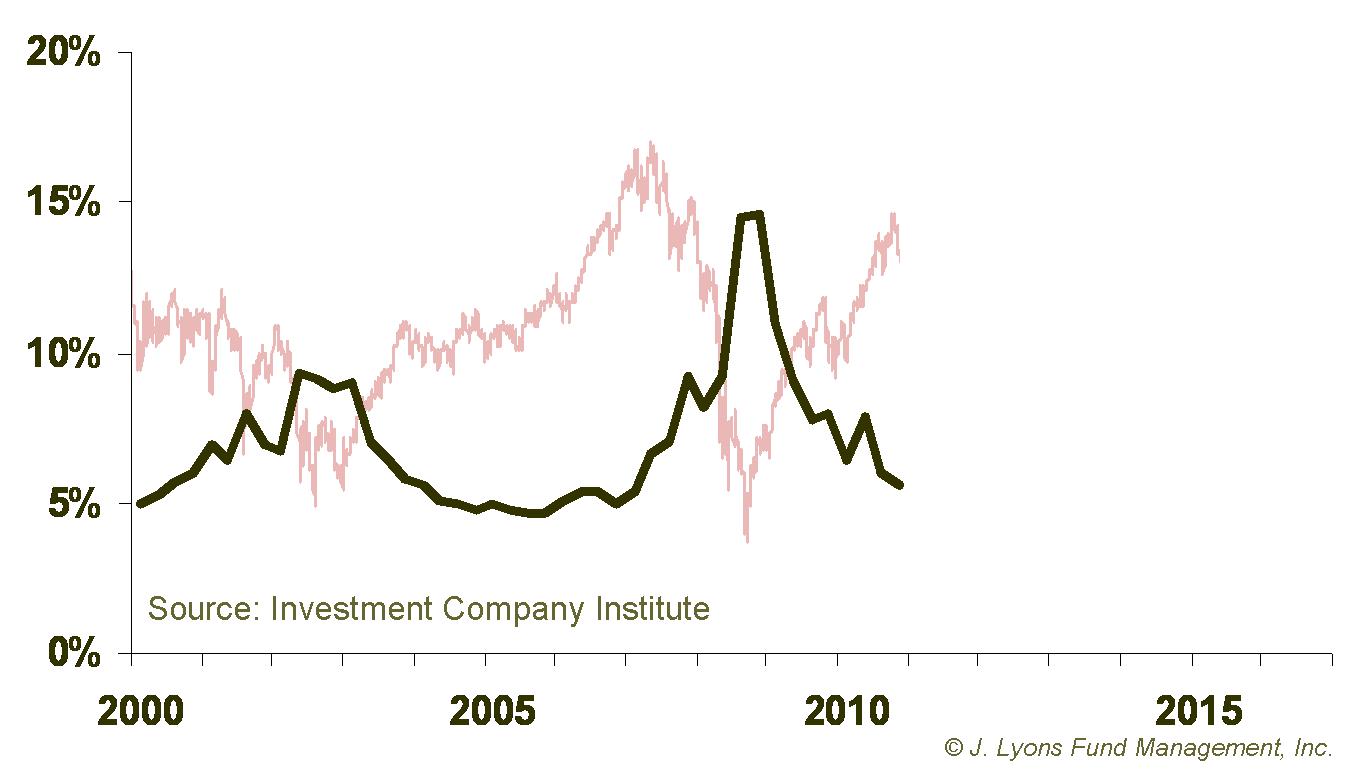
The data begins in the 1980's so we cannot make comparisons with the previous secular bear market. However, we can look at the current reading as it relates to the data since the beginning of the current bear. The chart displays the cash amount as a percentage of the stock market capitalization. In other words, it shows the ratio of dollars in retail money market funds to dollars in the stock market.
As the chart indicates, since 2000 retail money market assets have bounced between 5% and 15% of stock market cap. It is not surprising to see that peak levels in money market assets occurred at the stock market lows in 2002 and 2009. This is partially due to the drop in market cap as stock prices came down. But it largely reflects investors moving money out of stocks and into money markets for protection during those periods. Conversely, low levels of money market assets exist at market tops.
Currently, retail money market assets are approaching the 5% level that has coincided with market tops over the past 11 years. To be fair, money market assets did move to approximately 15% of stock market cap in 2009, a similar level reached back at the start of the secular bull market in 1982. Additionally, money market levels can remain low for an extended period as they did from 2005 to the eventual market top in 2007. However, it cannot reasonably be argued that retail money market assets are at high levels right now, much less can they be considered a mountain of cash. And they are certainly not at a level where they can be considered an adequate potential source of fuel to launch a secular bull market.
% of Household Assets in Money Market Mutual Funds
Another measure of cash is the Federal Reserve Board's quarterly tally of household assets in money market mutual funds. This data comes from the same report as the percentage of household assets invested in stocks. While this data exists back to the 1950's, these funds did not become a popular vehicle for cash until the late 1970's. Therefore, we cannot compare this data with the previous secular bear market either. However, we can again look at how the data has fluctuated since the bear market began in 2000 and view the current reading in relation to the post-2000 range.
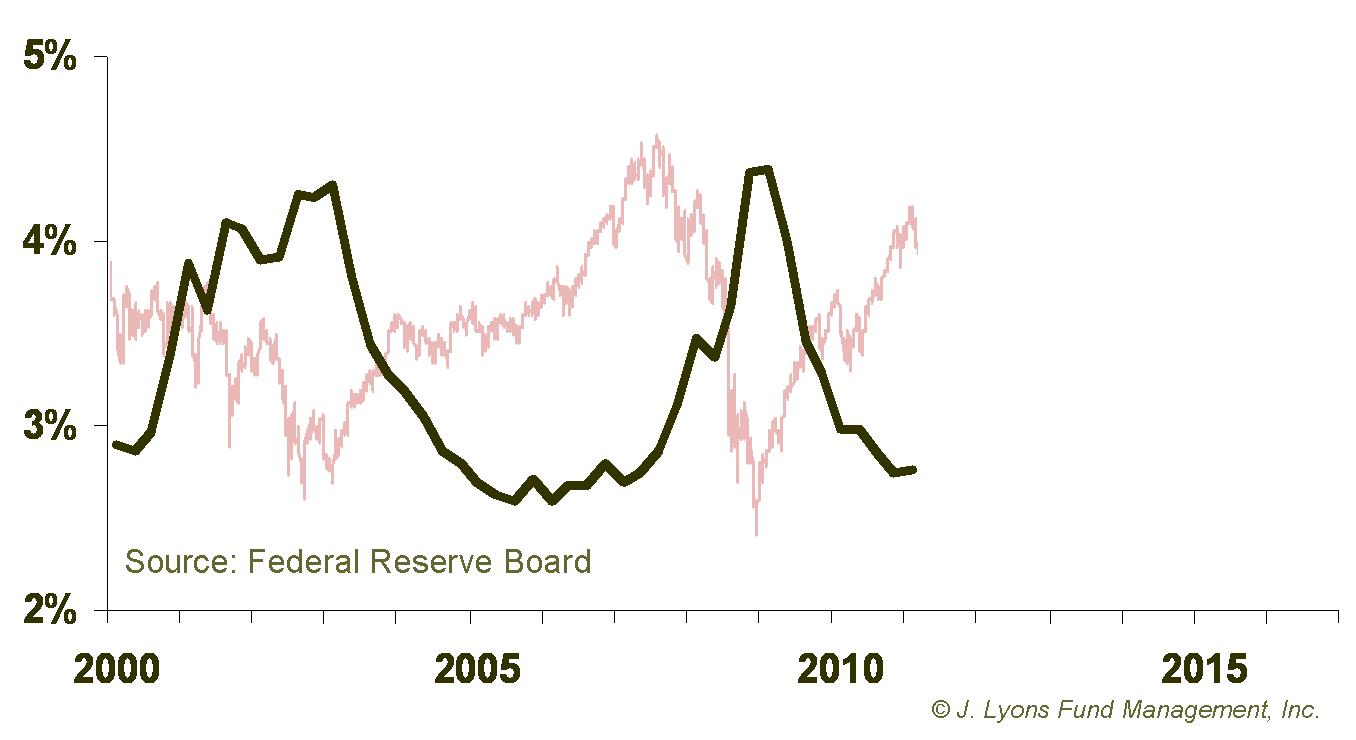
The chart displays the percentage of household assets that are invested in money market mutual funds. It has consistently bounced between levels just below 3% to just above 4% over the past eleven years. Like the retail money market assets, the high levels of investment in money market mutual funds occurred at the market lows of 2002-03 and 2009. Alternately, low levels coincided with market tops in 2000 and 2007. This is more evidence of investors' tendencies to buy high and sell low.
As with retail money market assets, the percentage of household assets in money market mutual funds is currently at the low end of the range of the past eleven years and is actually at a level that has marked market tops, not bottoms. Like the retail money market data, these readings can stay low for some time as they did in the mid-2000's. However, once again, there is neither a mountain of cash on the sidelines in money market mutual funds nor is there substantial fuel for a potential secular turnaround in the market.
Interestingly, since this data comes from the same report as the stock investment data, it may appear somewhat surprising that both percentages are moving lower. That is, both the percentage of household assets invested in stocks and the percentage in money markets are falling. Given the historical negative correlation between the two asset classes, it would be logical to think that if one is falling the other one is likely rising. So if that is not the case, then where is the money going? Given what we looked at last month, the answer is probably a combination of things. Debt reduction, alternate savings accounts and various bond instruments seem to be the destination of a large portion of the assets. These are all productive measures, however this asset reallingment is still a long ways from putting households and investors in a position to support a new bull market.
Mutual Fund Cash Holdings
A final measure of cash that we are going to examine is the amount of cash held by stock mutual funds as a percentage of their total assets. While stock mutual funds are almost entirely invested in stocks at all times, they do maintain a certain portion of assets in cash. The main purpose is to meet any redemptions that may arise from their fund holders selling shares of the mutual fund. That allows funds to avoid selling their stock positions in order to raise cash to meet redemptions.
Traditionally, the amount of cash is kept at a low and consistent level. However, at times fund managers will raise cash levels higher than normal. This is typically done in response or anticipation of higher than normal levels of redemptions. As you might guess, higher redemption rates usually occur near market lows when investors become fearful of losses. Conversely, cash levels in mutual funds are typically at their lowest near market tops when stocks are performing well and redemption rates in stock funds are low.
Since the data series began being tallied by the Investment Company Institute in the mid-1950's, the percentage of mutual fund cash has historically fluctuated between 4% at the low end and 10% at the high end. Where are mutual fund cash levels today? 3.5%, which is just about the lowest level on record.
Like the money market assets, these low cash levels can persist for some time. In addition, there is evidence that because of the very low rates of interest that cash accounts currently earn, mutual funds may be turning elsewhere to place some of the funds normally earmarked for cash. However, even accounting for low interest rates, current mutual fund cash levels are extremely low. Whatever possible fuel the cash may provide can be up for debate. However, historically we know that bull markets begin when cash levels are high. When the secular bull kicked off in 1982, mutual fund cash was over 11% of fund assets.
Besides simply being indicative of market tops, low cash levels can be a danger once the market begins to turn lower. As more and more investors begin to redeem shares due to the falling market, fund managers must start selling stock holdings to meet the increasing redemptions. This can compound a market decline in that a falling market causes more redemptions which causes funds to sell more stock which causes the market to fall even further. Therefore, not only is the low percentage of cash in mutual funds more evidence of a lack of potential market fuel, it is actually a potential serious drag on the market.
Conclusion
It has been our contention for the past decade that U.S. stocks are in a secular bear market. The sideways action in the market during the period has supported that contention. It is also our belief that stocks will remain in a bear market for the better part of the next decade. Based on current conditions and historical evidence, this is likely to be the market's fate regardless of events or actions taken to counteract the trend.
There are certainly other market observers, in fact probably the vast majority, who hold the opposite view. Much of their argument for a more positive long-term outlook is based on claims that there is a "mountain of cash" sitting "on the sidelines" that will provide "fuel" for stocks once it finds its way into the market. In response, we examined various measures of cash and other patterns of investor behavior to see if there is a basis for these claims.
Similar to Part 1 of our study of potential market "fuel" in which we found improved but not yet sound-enough household balance sheets, investors have reduced their excessive allocation to stocks that they had at the beginning of the secular bear market in 2000. However, they are still only at long-term mean levels of stock allocation. Like many indicators, investors' allocation to stocks should reach an extreme low level before a new secular bull market is ready to launch. In addition, the various measures of cash that we examined are all closer to levels that have marked peaks in the stock market during the course of the bear market. Therefore we have found no basis for the mountain of cash argument.
Is it possible that there are other areas in the economy where large amounts of cash exist and that these areas could fuel a secular turnaround in the market? Corporations' cash holdings are at very high levels now, for example. However, that money will go toward whatever is best for the individual companies and cannot be expected to directly find its way into the market. Furthermore, corporate profitability is high right now mostly as a result of companies cutting costs and not spending cash needlessly. If there were better uses of this cash, it would not be sitting idle right now, as much of it is.
The federal government, of course, could print as much money as it wants. However, it has already done so in historic fashion without much to show for it. That is the quandary they are in as the more money they print now, the less benefit achieved by it and the more harm it is likely to do instead. Foreign countries are also potential investment fuel sources. However, most of the developed countries with enough assets to make an impact are in the same fiscal situation as the U.S. And the foreign countries that are in good shape, predominately emerging markets, are in good shape largely because of the support of U.S. consumers. It would be backward thinking to expect emerging markets to begin carrying the U.S. economy.
To be clear, history tells us that the individual investor will not participate in the initial stages of a secular bull market. Human nature, in the form of fear, is working too strongly against them at that point. However, secular bull markets do begin when households and investors are in their fiscally strongest and most liquid condition. It is this condition that produces the appearance of potential economic "fuel" capable of supporting a new secular bull market. Unfortunately, after an examination of the fiscal soundness of U.S. households as well as various measures of investor cash, that potential fuel is simply not there. Right now, this economy and market are running on fumes.
Dana Lyons
Vice President
Copyright (C) 2011 J. Lyons Fund Management, Inc. All rights reserved.