| June 2011 |
Running on Fumes
Part 1: Household Balance Sheets
How much fuel is there in the U.S. economic tank currently -- and is it enough to propel us into a new secular bull market?
Longtime clients and readers of our Newsletters are familiar with our overarching belief that the U.S. is in the midst of a secular (long-term) bear market. That has been our belief since around the onset of the bear market at the bursting of the tech-stock bubble in 2000. Secular bear markets tend to move sideways or downward for an extended period of time, offering investors little to no returns. Therefore, we are not surprised that most of the major stock averages are no higher than where they stood in 2000. We also believe this secular bear market has several more years to go since they tend to last approximately as long as the preceding secular bull market (18 years in this case: 1982-2000.) So another seven or so years of little to no net returns is still in the cards. The cycle of alternating secular bear and bull markets has been extremely consistent for the past 200 years and we believe it’s going to continue -- no matter what happens economically, fiscally, politically or any other “ly”.
Lately however, there has been a growing drumbeat on Wall Street (shocker) that the secular bull market is back -- or never left -- and that all is hunky-dory in the equity world. Just in the past few weeks we have seen analyst calls for the Dow Jones Industrial Average to reach 20,000 and even 35,000 in the not-too-distant future (the Dow is currently around 12,000.) The reasons given -- low valuations, corporate profits, a mythical mountain of cash on the sidelines, etc., etc., etc. -- all lead to the scariest four words an investor can hear: “this time is different.” Some of those arguments may certainly be valid; however, we reiterate that in our opinion, it does not matter. The secular bear market has several more years to go before it runs its course, no matter the prevailing conditions.
In an effort to examine how much ammo those in the secular bull camp are holding, we decided to analyze present fiscal and economic conditions in the U.S. We wanted to see how supportive those conditions are currently in their potential to launch a new secular bull market. In other words, how much potential fuel is in the U.S. tank? Next month we will look at the fuel from the standpoint of U.S. investor assets and investment behavior. But we begin this month with a look at the balance sheet of U.S. households.
How Much Fuel?
U.S. Household Balance Sheets – Comparing the 1970's vs. the Present
As we always stress when making market comparisons, it is crucial to look at corresponding periods in cycles in order to get a valid and meaningful perspective. It makes no sense, for example, to compare households’ credit and mortgage liabilities with their 2007 levels. They are obviously less leveraged than they were at the peak of the housing/credit bubble but that provides no help in estimating their potential ability to support a new bull market. Thus, for a more constructive exercise we are comparing current U.S. household balance sheets with those in the mid-1970’s, about a decade into the previous secular bear market.
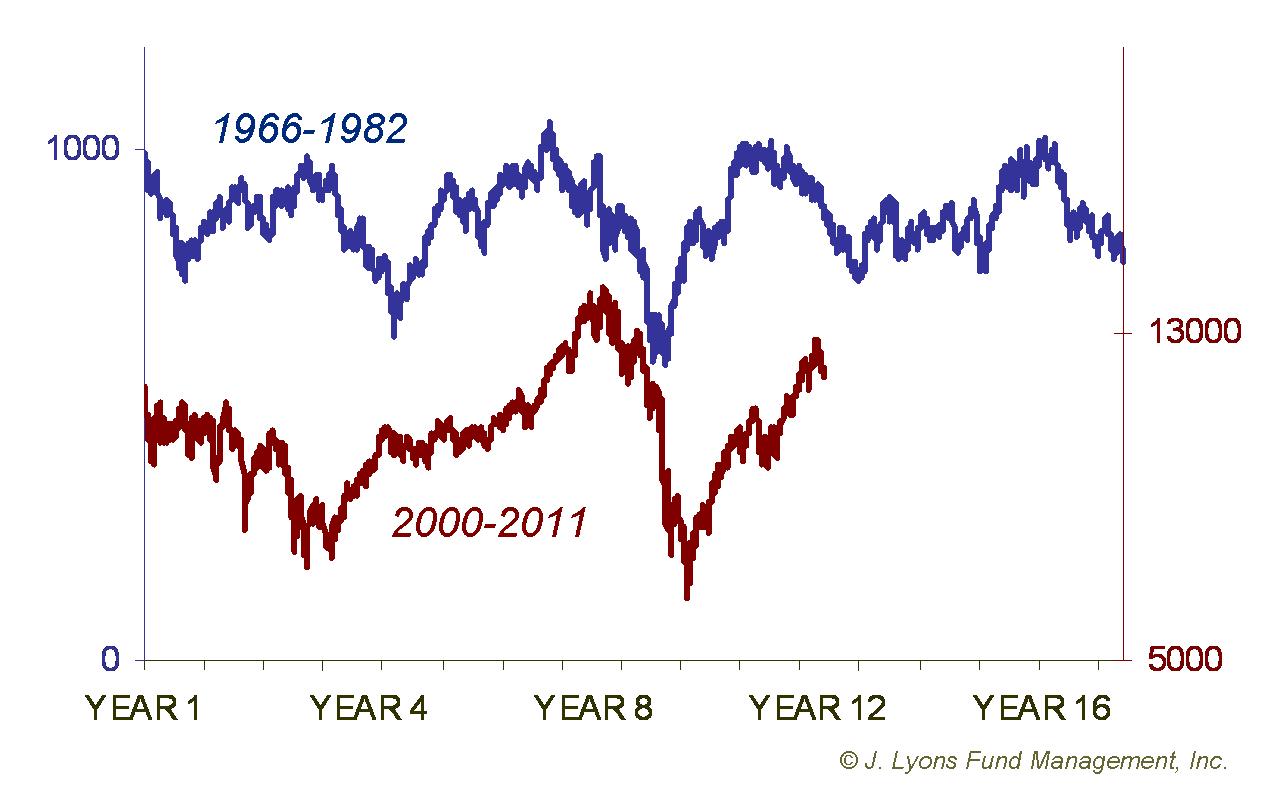
At a comparable point in the 1970's, the secular bear still had another 5-6 years to go before a new sustainable bull market was launched in 1982. Does the current secular bear market have several more years in it as well? How do current household conditions stack up versus that period? Also, typically indicators will not only correct to the mean but go from one extreme to the other before a lasting recovery begins. That is particularly true after such excessive readings like those witnessed during the recent housing and debt bubble. Have balance sheets recovered yet to the opposite extreme, or even to the mean?
Disposable Income
Last month we showed that overall personal income is down almost 5% since the onset of the secular bear market in 2000. Contrary to the first half of the 1966-82 secular bear when income rose nearly 10%, this is a drain of potential fuel from the household tank. Let’s take a look at households’ disposable personal income (DPI), money households have left to spend after taxes.
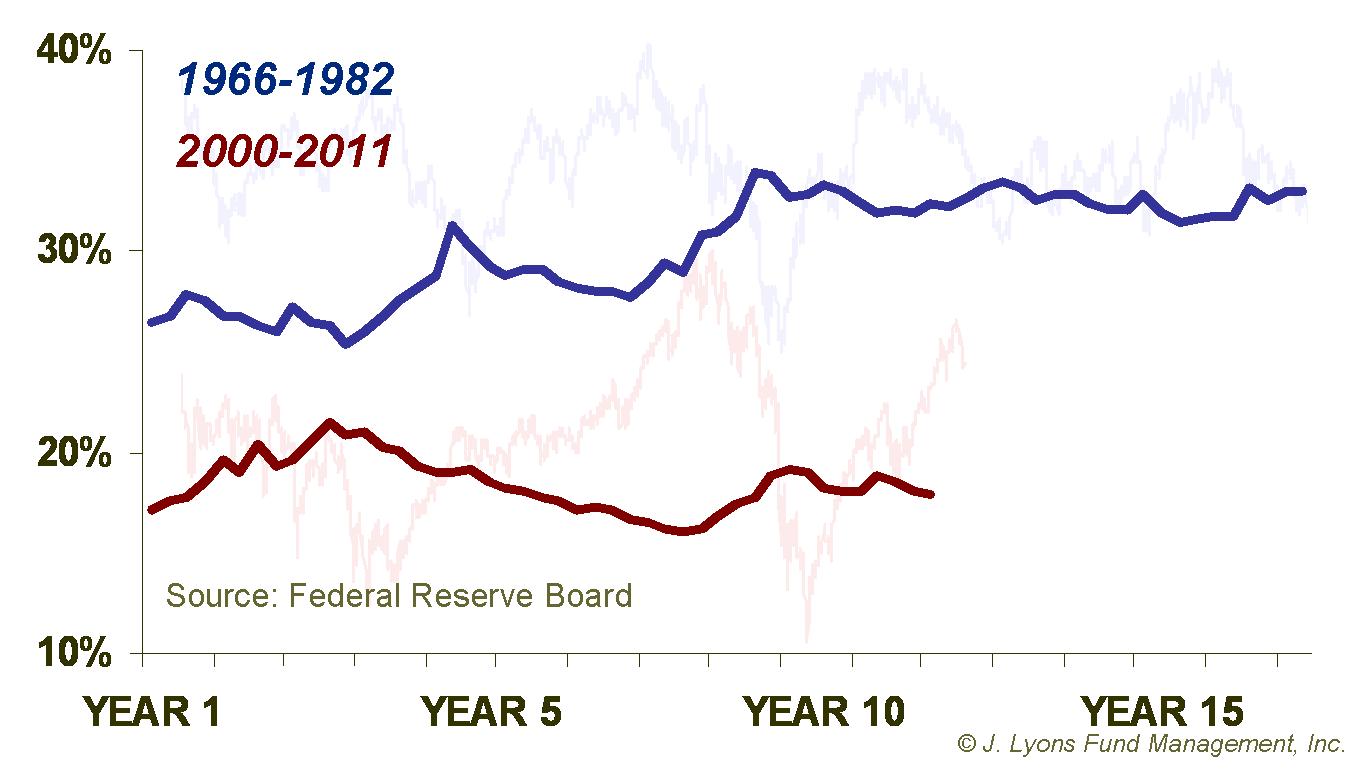
DPI is currently 18% as a percentage of total household assets, about where it was in 2000. The long-term mean is 26.5%. About 11 years into a bear market in the 1970’s, DPI was 32% of total assets, 14 percentage points higher than where we are today. “Fuel” in the tank was rising then and would eventually help provide the springboard for a new secular bull market. However, that bull was still 5 years away from being launched. Compared with then, we certainly can’t look at disposable income levels now and expect them to be supportive of a new bull market even 5 years from now, let alone any time soon. And with high unemployment and low capacity utilization, income and wages aren’t likely to climb meaningfully any time soon.
Household Debt
With disposable income levels low, and certainly not in position to fuel a turnaround in the secular bear, it’s up to the other side of the balance sheet to bail out the market: liabilities, specifically household debt. Low levels of debt leave more money for consumers to spend and potentially spur the economy and fuel the market. Unfortunately, anyone who hasn’t been living under a rock for the past few years (and thus does not have 8 credit cards and multiple mortgages) knows this next chart on household debt is not going to be a pretty one.
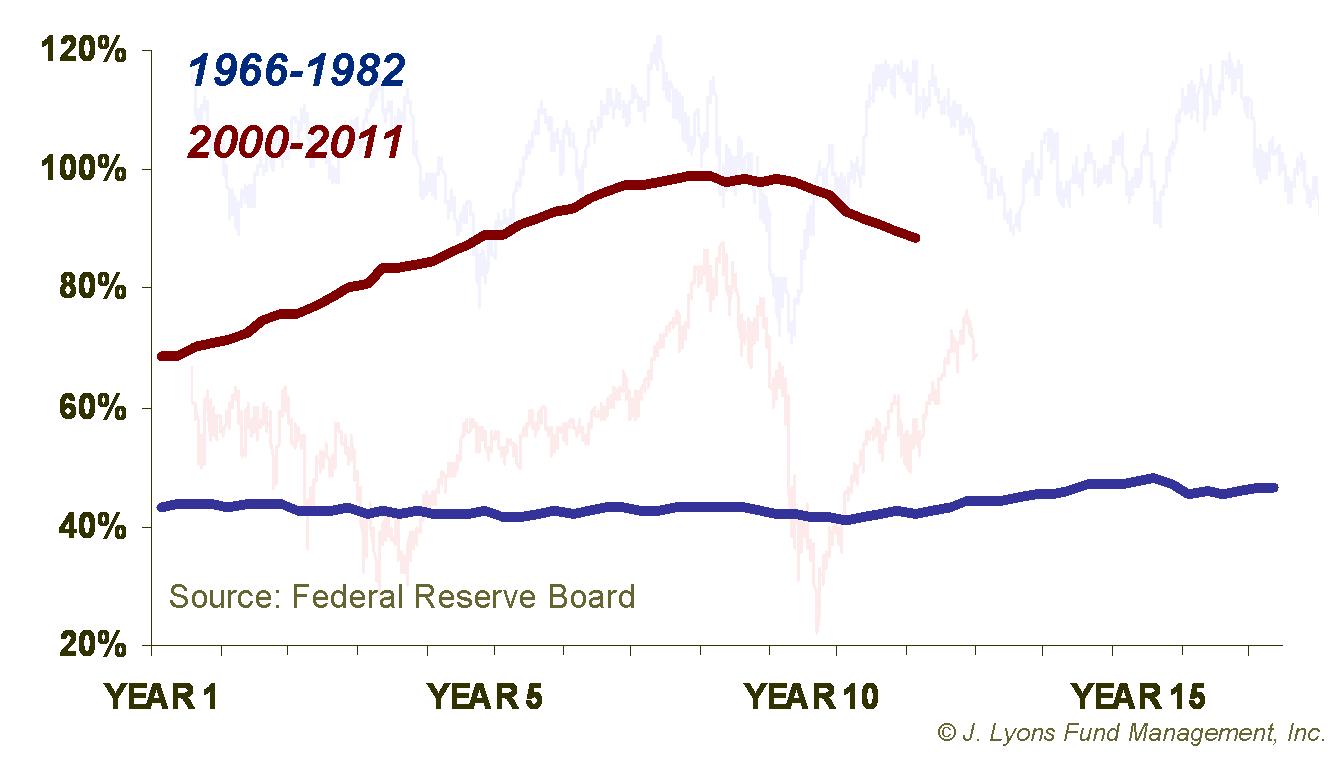
For sake of comparison, household debt is displayed as a percentage of GDP. Currently, household debt is 89% of GDP. The good news is it is down from 99% at the peak of the housing and credit booms in 2007. The bad news is obviously that it is still 89% of GDP. At the comparable point in the 1970’s, household debt was just 42% of GDP, less than half of what it is today.
The average level of the past 50 years is 54% so we have long, long way to go before we even reach that point. Furthermore, as we have mentioned, when data moves to an extreme, it tends to not only correct to the mean but will move to an extreme in the opposite direction before its correction is complete. Whether or not household debt levels reach the long-term mean or a lower, extreme level it is another headwind that will have to be worked through before it is in a constructive position to support a new secular bull market.
In addition, as household debt levels work lower, it actually works as an inhibitor to economic and market growth. It is a healthy and necessary adjustment in order for households to get their financial houses in order. However, the deleveraging process removes economic stimulus as the process runs its course. This is yet another draining of potential fuel for a secular turnaround.
Savings
A possible offsetting factor to low levels of income and high levels of debt is the savings rate. A high savings rate could indicate a potential fuel reserve that could be tapped and thus generate growth, economically or market-wise. Unfortunately again, that reserve is not there. As could be expected, if money is being poured into areas of debt at near-record levels, there probably is not much going into savings.
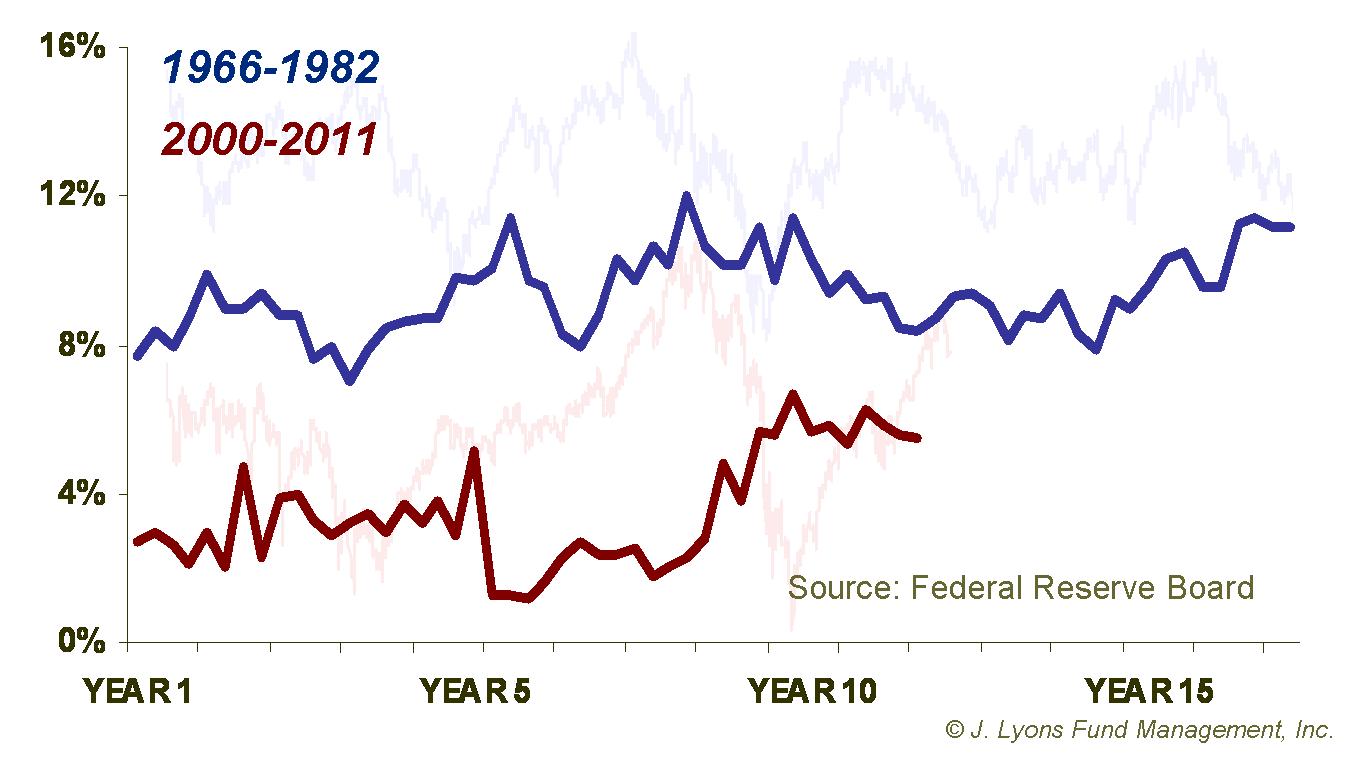
At 6% currently, the U.S. savings rate is still below the mean of the past 50 years of 7% and definitely not in position to support a major boom in the market or the economy. Furthermore, it is well below where it stood at the comparable period in the 1970’s. At one point during the 1970’s it reached 12% and it stood at 11% when the secular bear market ended in 1982, serving as a fuel reserve to spur a new bull market.
At least the savings rate has come off of its lows of near 0% which it hit several times over the past decade. This rise in the savings rate is constructive in shoring up households’ balance sheets. Perversely however, like the fall in household debt, a rising savings rate works against economic growth. Like a potential consumer who decides to put money into a savings account instead of spending it, a rising savings rate reflects dollars that are not going into the economy. This represents another temporary drain in economic/stock market fuel.
Net Worth
So where does this leave the U.S. household fuel tank and its potential to launch a secular bull market? Well, if the asset side (income) of the balance sheet is low and the liability (debt) side is high, the tank cannot be very full. One measure that incorporates all of this is net worth. We want to see net worth at high levels and rising as a sign that U.S. households have sufficiently repaired their balance sheets and accumulated enough “fuel” to potentially power a new bull market. Unfortunately, net worth as a percentage of total assets, is low and, until recently, falling.
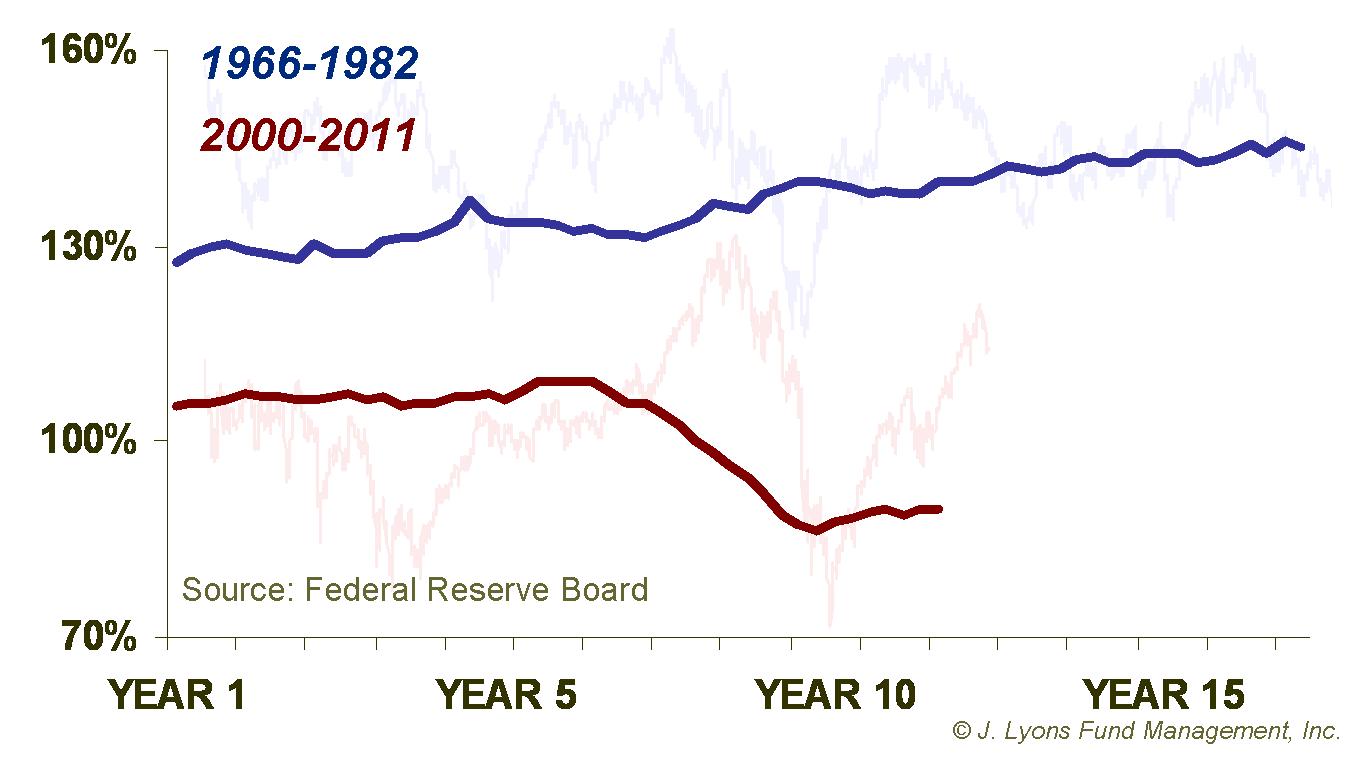
Currently, net worth is 89.5% of total assets, just off the all-time low of 86.4% in the 2nd quarter of 2009. It is also down from about 106% at the onset of the secular bear market in 2000 and well below the long-term mean of 129%. Relative to the secular bear market in the 1970’s, the ratio looks even bleaker. 11 years into that bear, net worth stood at around 140% of assets on its way up to around 146% at the launching of the bull market in 1982.
Conclusion
Throughout the duration of the 1966-1982 bear market, households steadily repaired their balance sheets, increasing their net worth by reducing debt and increasing savings, on top of rising income. This put them in financial position to help launch the secular bull market in 1982. In contrast, from what we’ve looked at above, none of these trends are true today. They are especially not true to the degree that households have put themselves into position to support a long-term, sustainable turnaround in the market.
It is true that households have deleveraged somewhat from bubble levels over the past few years as well as increasing their savings to a moderate level. However, this data still has a ways to go to even correct to the long-term mean. Plus, after reaching historic extremes during the bubble, it is reasonable to expect the correction to bring the data to extreme levels in the opposite direction.
Although this repairing of household balance sheets is a healthy and necessary process, it also unfortunately works as a drag on growth. The more dollars saved, the fewer dollars spent and the less debt incurred, the less fuel going into the economy and the markets. Don’t get us wrong, this repair is a good thing (we wish the federal government would undergo such repairs.) However, until this process has progressed much further, U.S. households will not be able to provide the fuel needed to power a new secular bull market. Right now, their tank is almost empty.
Finally, notwithstanding the dismal financial picture we point out above, we will hasten to add that we are well aware that it is not the public’s buying that supports the beginning of new secular bull markets. In fact, the public is distinctly absent at stock market bottoms and really doesn’t participate until the market is substantially well on its way. However, they are the reason that the economy can mount a sustainable enough recovery to provide the underpinnings of a solid U.S. stock market recovery. They appear to be far from that position now. Moreover to date, we only see rallies similar to those in former secular bear markets and those prove to be but transitory.
Next month in Part 2 of this study on economic "fuel", we will examine various levels of investable assets as well as trends in investor behavior.
Dana Lyons
Vice President
Copyright (C) 2011 J. Lyons Fund Management, Inc. All rights reserved.