| May 2011 |
Did
You Hear the One about the Frog in the Boiling Economy?
The Importance of Perspective
It is said that if you put a frog in lukewarm water and increase the temperature slowly, the frog will not resist being boiled to death. I have not tried that experiment personally, but having noted that a similar lack of perspective can plague us humans, I can believe that it is true. In our Newsletter Archives, you'll find the results of previous research that we have done over the last few years and on which this paper will piggyback. That research points out just how closely the current secular (long-term) bear market cycle, which began with the tech collapse in 2000, is tracking the historical average profile of previous secular bear markets (see The Crash of 2008 - What Now? and Another Lost Decade Ahead?). We have been arguing since that market top in 2000 that the U.S. stock market would go a net nowhere for the next 16-20 years. This conclusion came not only from an examination of the pattern of historical bear markets but also from the study of the aftermath of investment bubbles such as the tech bubble of the late 1990’s.
This month we offer our current retrospective which involves a look at Household Income during the current and previous secular bear markets. The hope is that this study, while not particularly encouraging, might possibly assist in obtaining and maintaining perspective as well as preparedness -- attributes which the unfortunate frog sorely lacked.
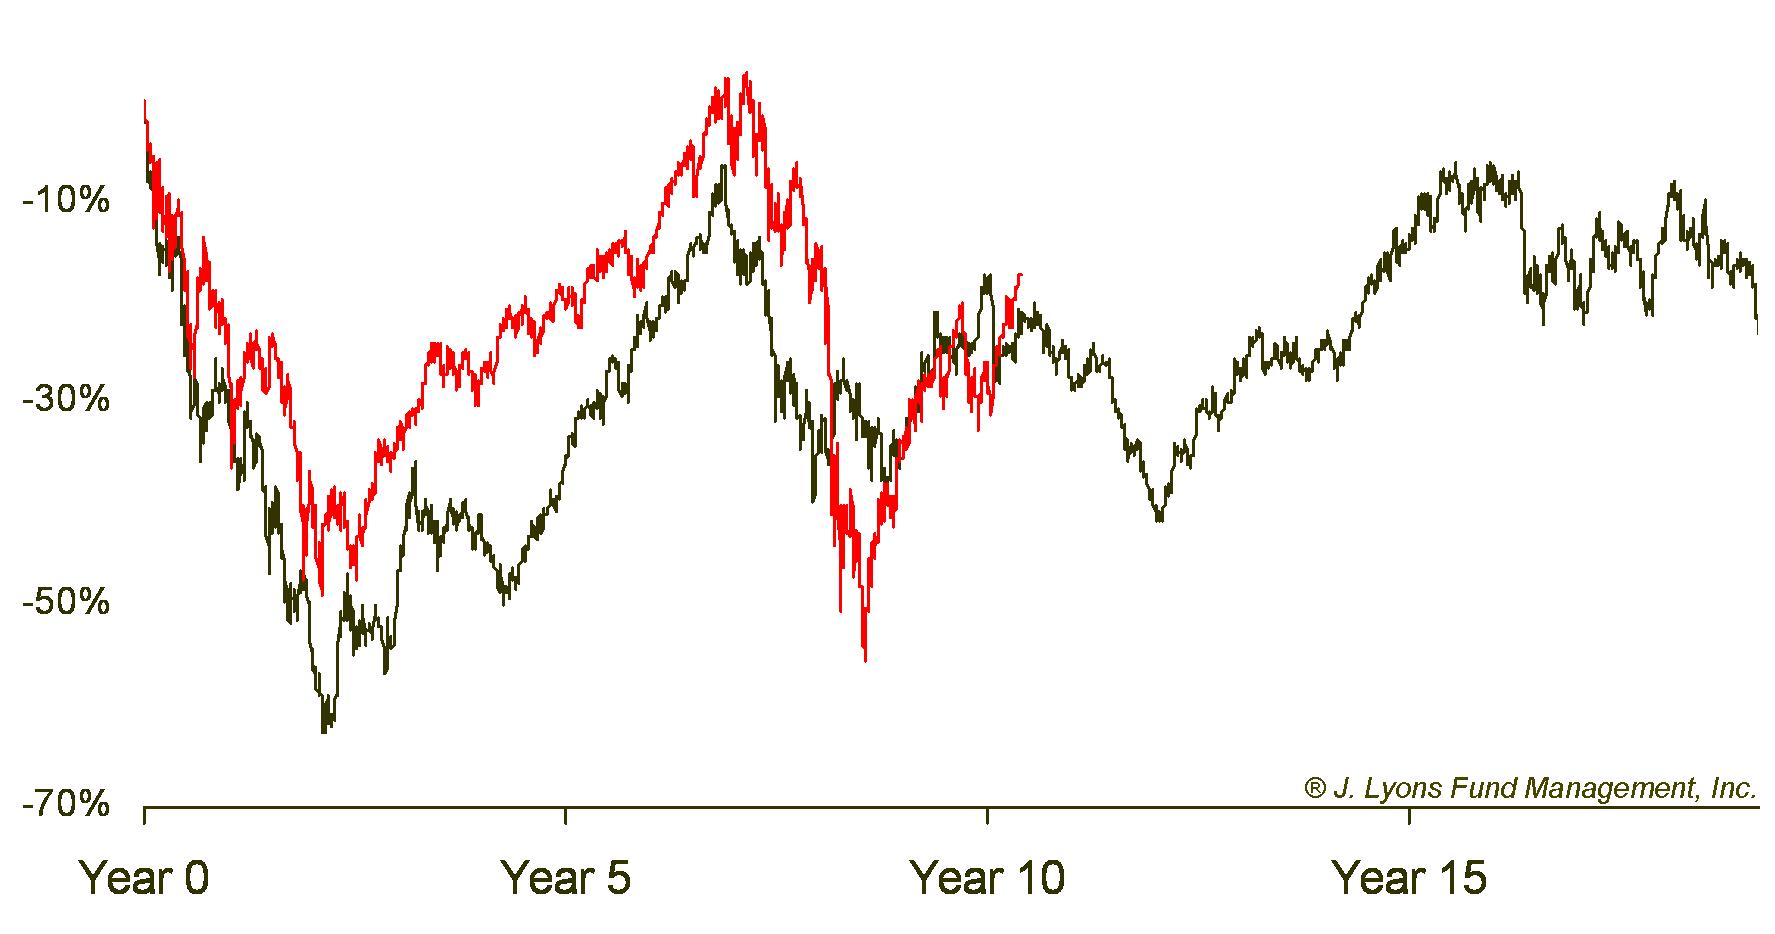
As can be seen in the reports referenced above and in the following graphic, the performance of the markets of the first half of this secular bear period has uncanny resemblance to previous corresponding periods. We will be quick to add that it is not our contention that the current stock market will necessarily continue to have this close a resemblance to past corresponding secular bear periods. Our primary conclusion is simply that during secular bear markets, stocks in general make no real progress from beginning to end of the 16-20 year period.
Household Income and the Secular Cycle
Discerning Trend Implications
This month, in an attempt to gain a bit more perspective as to how hot the frog’s water is going to be and for how long, we thought it might be interesting to examine other variables in the U.S. economy, specifically the income picture of U.S. households. We chose to examine household income as we feel it is not only somewhat of an indication of the potential reservoir of investment fuel for a subsequent stock market recovery but also an indication of prevailing sentiment. This sentiment could provide, or not provide, a conducive atmosphere for meaningful improvement not only in the economy but in the stock market as well.
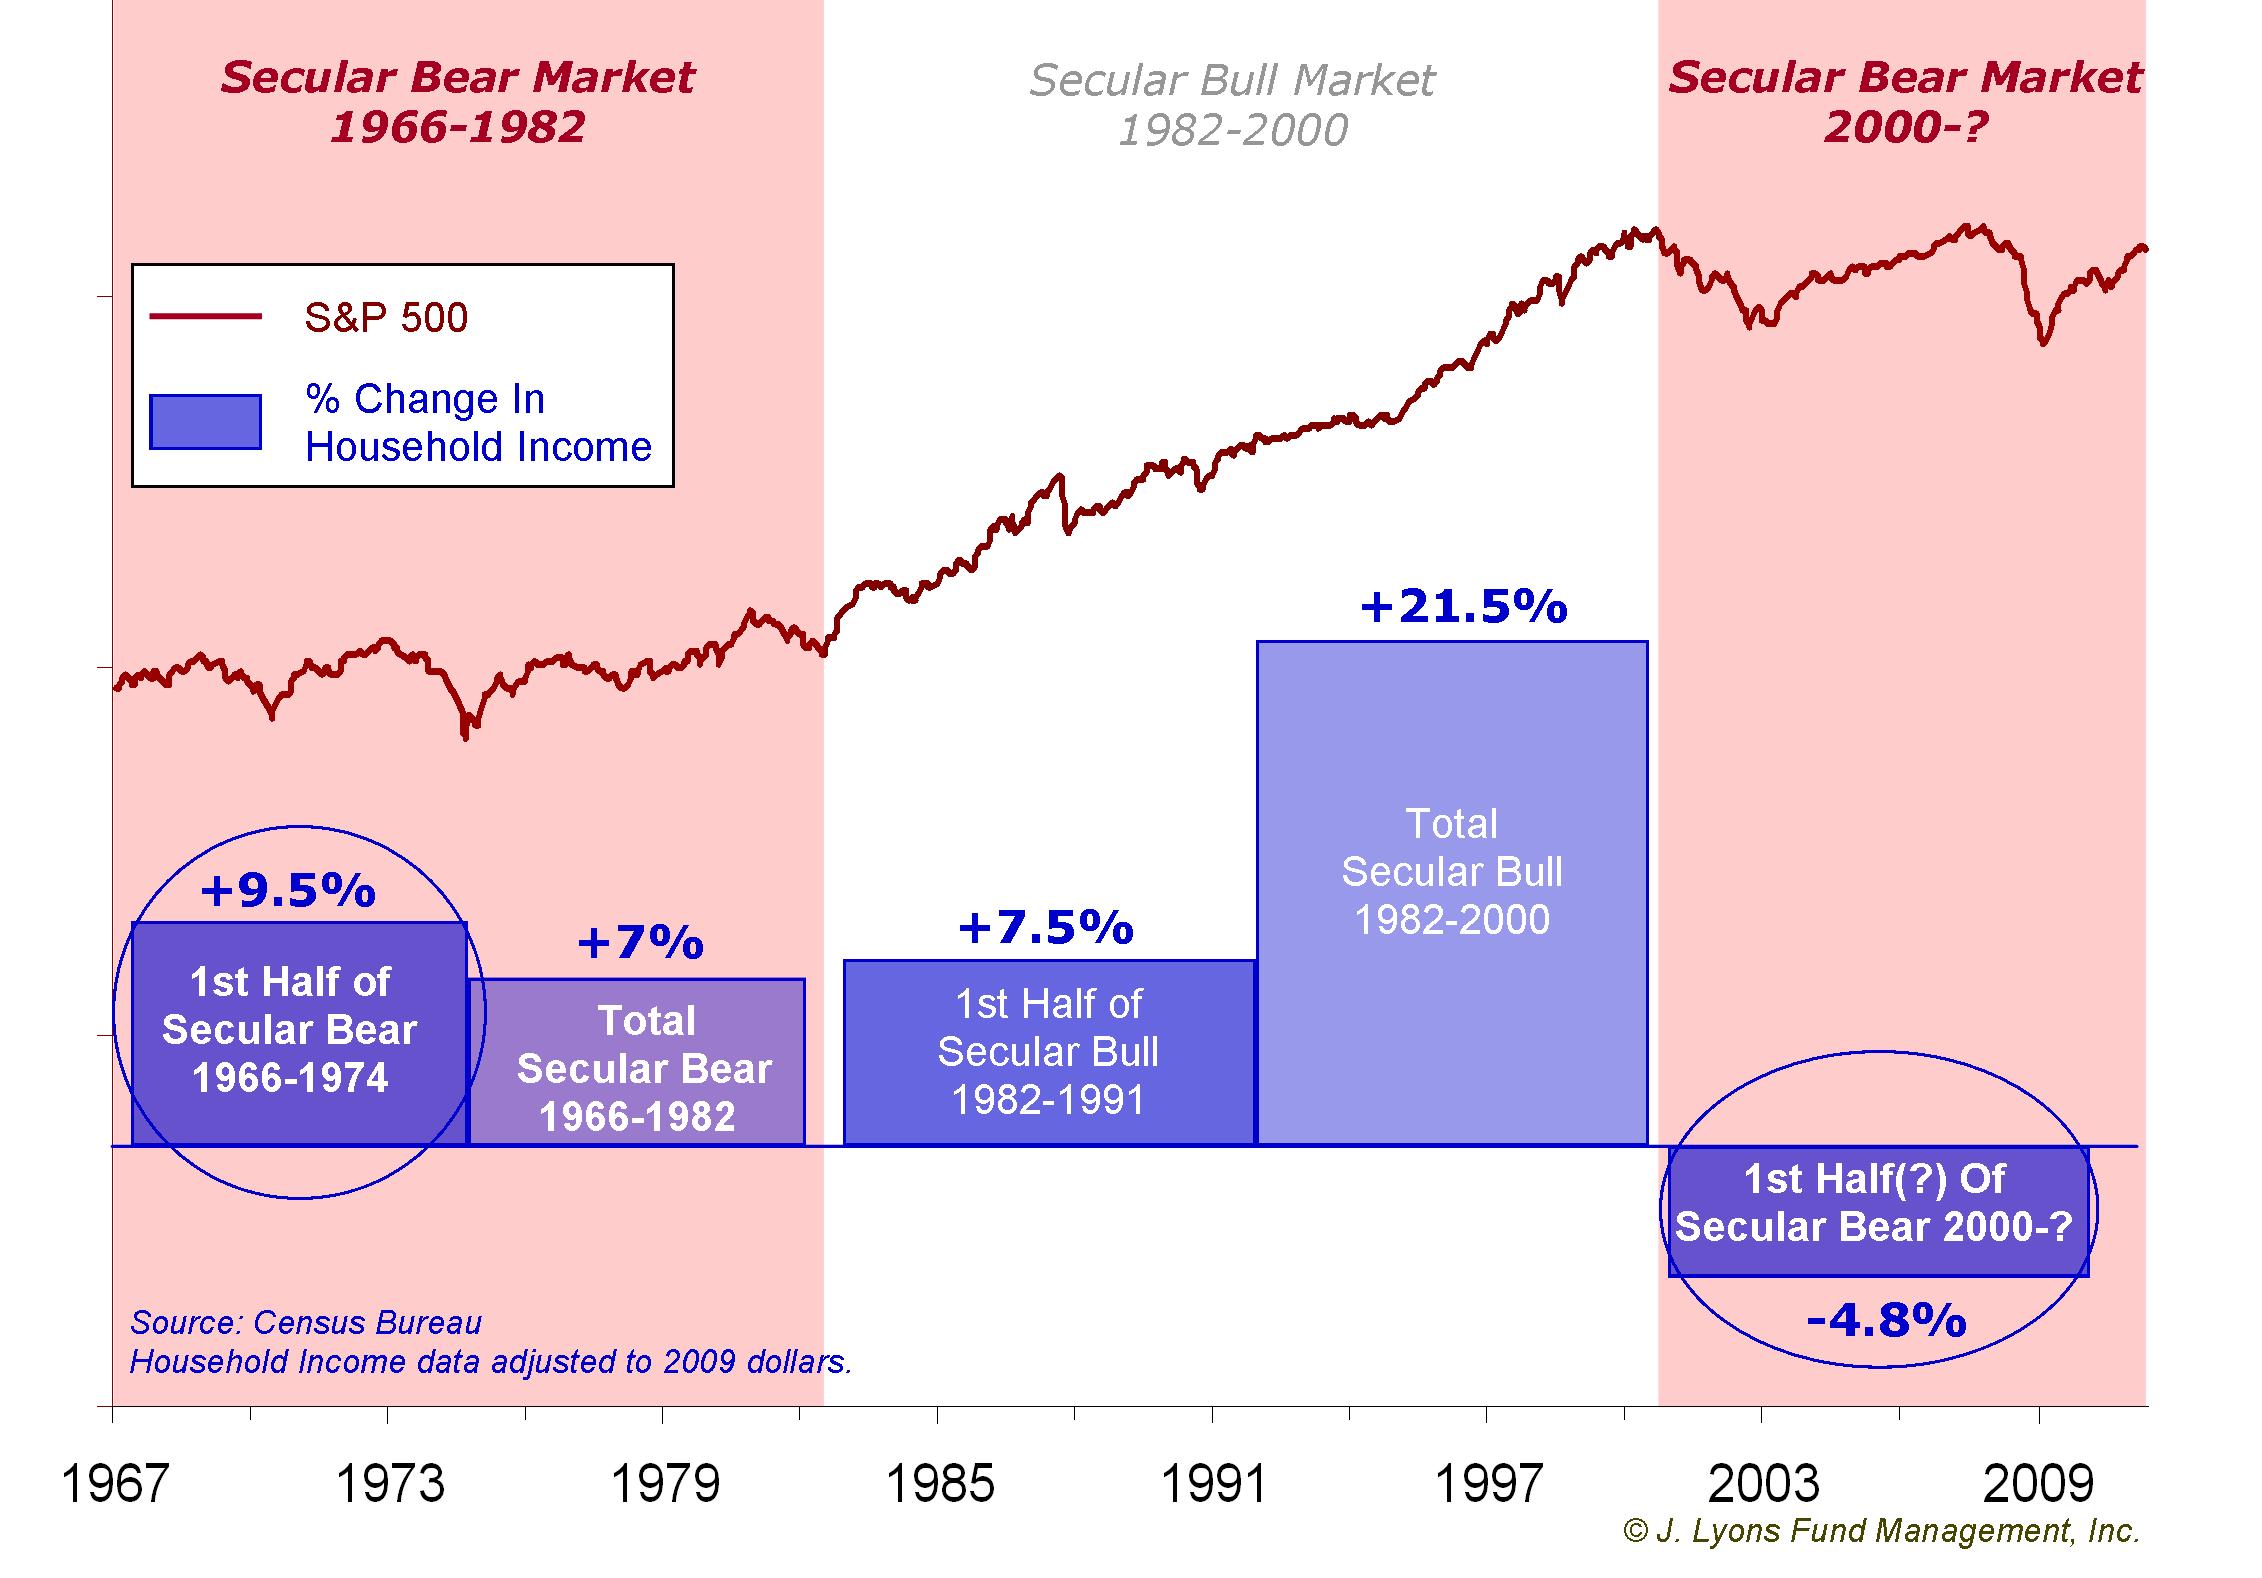
As we have often stated, it is our strong belief that comparisons between market phenomenon are most -- or perhaps only -- relevant when done between similar times in market cycles. We therefore decided to look at and compare the growth of Household Income during the first half of the current secular bear market with income growth during the first half of the last secular bear, which took place between 1966 and 1982. Since the average secular bear market lasts 18 years, we are comparing what median household income has done from 2000 to 2009 with the period from 1967 (the first year that such data is available) to 1974. Unfortunately, we do not have data from the last comparable period previous to that one, 1929-1939. We have included on the graphic the statistics of the intervening secular bull market years, 1982-2000, just for interest sake.
As can be seen, Household Income during the first half of the last secular bear market (1967-1974) increased by 9.5%. That income growth not only greatly exceeds that of the first half of the current bear market, but you will note that Household Income has actually decreased by almost 5% from 2000 to 2009 (the latest year for which figures are available).
The samplings used in this analysis certainly may not be numerous enough to offer conclusive guidance to be sure but we still believe that this comparison has negative implications for a recovery in the economy. We also think it reinforces our conclusion that the market will end up making no net progress between the highs hit in 2000 and the level it ends up at when this secular bear has finally run its course, perhaps 6-8 years from now. In addition, we feel that these conclusions are further reinforced if one considers the following.
- The still worsening housing market and its negative effect on the net worth of individuals and families
- The relatively low savings rate in the U.S. which, at just 5.5%, is half of what it was in 1974
- The U.S. household debt at the end of 2009 was over 90% of GDP, twice the level of 1974
- The still bleak employment situation, of which the Federal Reserve Bank of San Francisco says, “significant labor market slack will persist for several years”
Expanding on the employment point, according a study titled “A Decade of Labor Pain” by Michael Mandel, the employment picture of the past 10 years is somewhat alarming when compared to what it was during the first 10 years of the Great Depression, 1929-1939. Mandel concludes that although the public employment rate [he includes the government as well as heavily government subsidized industries such as social services, education and health care in that group] has increased rather substantially in the recent 10-year period as it did in the corresponding Depression years, the private sector employment rate actually declined in both periods. Of concern is that the decline was worse in the recent 10 years than between 1929 and 1939! These facts lend perspective to the “big government” trend as well, i.e., the public sector group employment grew by 16% and the private sector declined by 8% in the last 10 years. [Statistics in this study were obtained from the Bureau of Labor Statistics.]
In
one way we humans, like frogs, fortunately have been given
the ability to take each day as it comes. But in so doing we also fail
to gain perspective if we look at each point by itself rather than
observing these points as part of
the ongoing trend. Very often it is the end of a trend at which
substantial change occurs and the most disruption takes place. This
substantial change that occurs at these points is such a departure from
what we have come to accept as normal that we have not prepared for it.
Such changes were dramatically seen with the bursting of the
tech stock
bubble in 2000 and more recently at the end of the rise in housing
prices.
Some
trends or cycles are well known and can be anticipated. The failure to
prepare for winter in North
Dakota, for example, has always had understandable and well known
consequences. Other trends as in the stock market, economy and within
society
may have less discernible patterns at a given time but a cursory study
of the past will reveal that they certainly exist. Not only do they
exist, but they
have paramount importance on our lives. History clearly shows the
potential consequences if we fail to observe, prepare for and
defend
against the impact of the parts of those trends that affect us
adversely. Societies have ceased to exist because the populace has
adapted to the "normalcy" of each successive point in time without
realizing just how adversely the “temperature” of their world is
trending.
Conclusion
In conclusion, there is an extant situation that perhaps is worth noting as an aid to having perspective. It is a very natural instinct to think that given the magnitude of the recent stock market move, we must be “out of the woods”. As we mentioned in a report over a year ago, most discussion that we read or hear in the media concerns questions like when will housing prices start to rise and when will unemployment rates get back to normal? It may sound like a small point but the real question is what is the trend of home prices and unemployment now and what is the appropriate action called for in this environment?
Skipping over the problem and trying to pinpoint the next opportunity equates to lost perspective. At the top of the substantial rallies during the secular bear markets in the 1930’s and the 1970’s as well as at the top of the market in 2007, it was commonplace to think the all-clear signal had sounded -- but it hadn’t. Unfortunately it is human nature to not only become more bullish toward both the stock market and the economy the higher the market goes but also to increasingly dismiss the opposite scenario. Becoming unable to maintain perspective about one’s environment is how the frog died. We admit that, as humans, we at J. Lyons Fund Management, Inc. are challenged by those human natural tendencies as well. However, observing history and betting against the “crowd” at trend extremes is our defense for staying out of “hot water”.
John S. Lyons
President