J. Lyons Fund Management, Inc. Newsletter
|
Another Lost Decade Ahead?
2011 Secular Bear Market Update
If you read last month’s Newsletter, you are familiar with our belief that the stock market is currently in the midst of a secular, or long-term, bear market. The ramifications are that stocks will experience significant alternating swings, up and down, but will generally move sideways for a period of roughly 16-20 years. We think it is fair to say that the past decade of, at best, sideways movement in the market has lent validity to our argument.
A few years ago, we first introduced a chart of a “secular bear market composite”. You may recall that we constructed the composite by simply averaging the market performance (using the Dow Jones Industrial Average) during the previous two secular bear markets, specifically those from 1929-1949 and from 1966-1982 (we only use these two secular bear markets in computing our composite since they are the only ones in which we have daily price data; however, this general market pattern has existed for centuries, both in the U.S. and abroad.) We compared the composite to the current secular bear market using the S&P 500 and produced the following chart.
(as of January 2009)
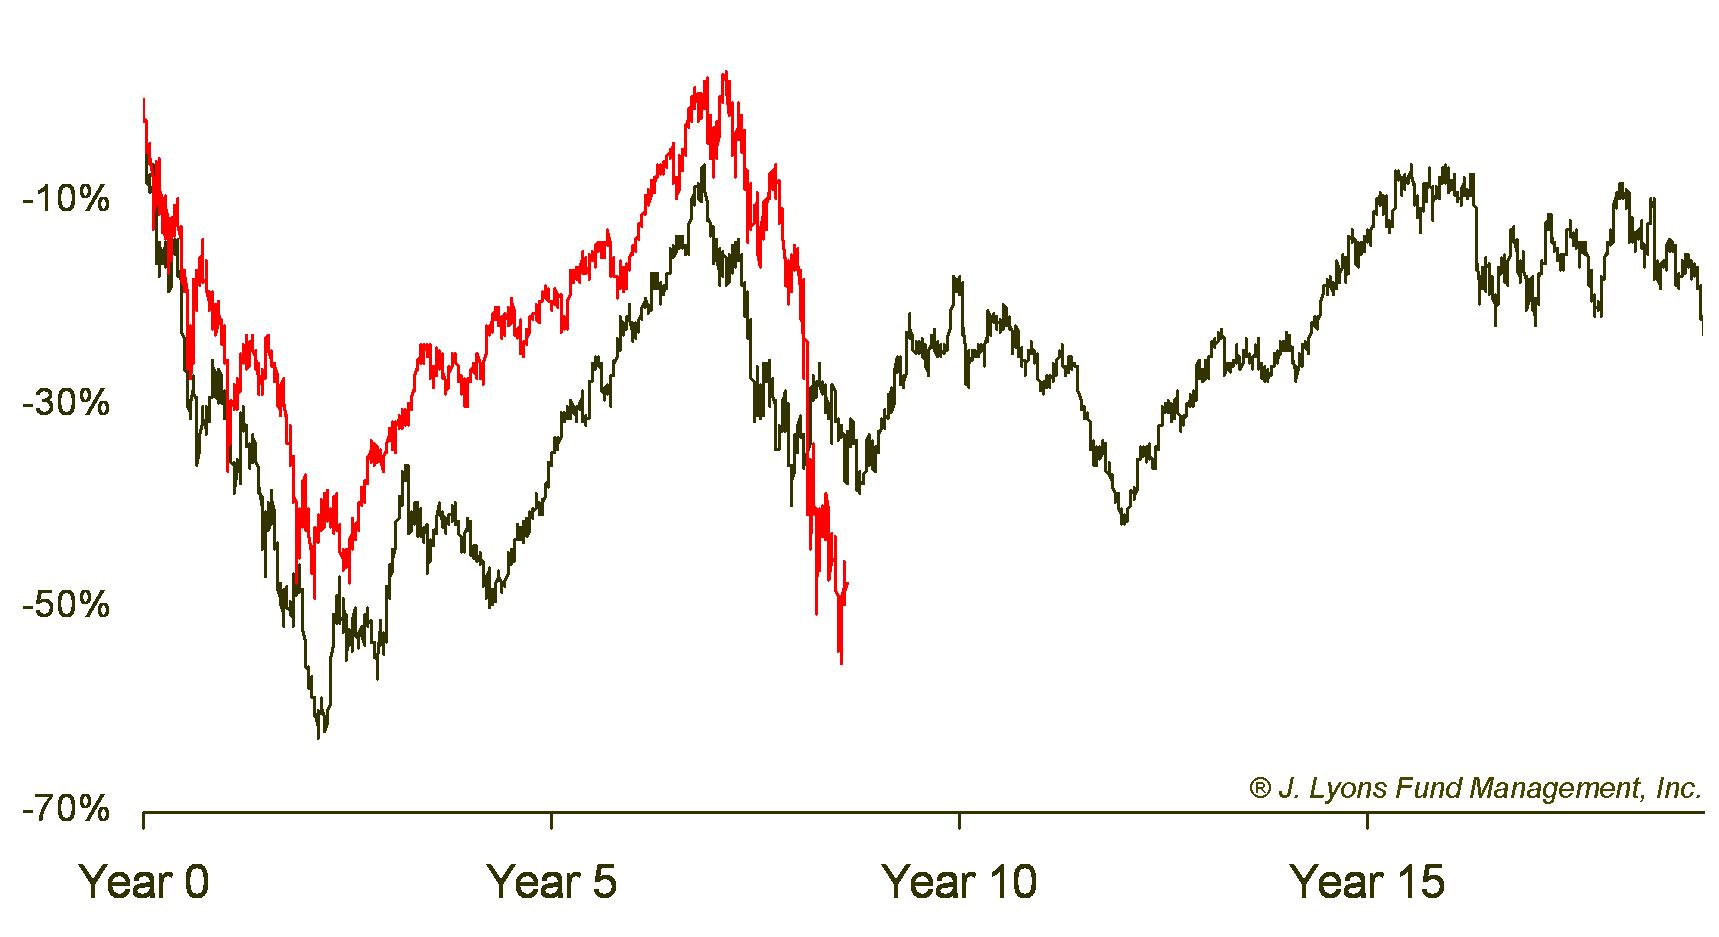
The goal in generating the composite chart was simply to provide a visual of the general pattern of a secular bear market in order to provide investors with an idea of what they can expect during such a period. As long as the current market somewhat tracked the general pattern of the composite, it would be easier to follow our contention that we were indeed undergoing a secular bear market. However, the current bear market traced the pattern of the composite so closely that we decided to continue to track the composite as the current bear market progresses.
Again, it is not our forecast that the current market must continue to track the composite so closely nor is this study something that dictates our specific investment decisions. However, we did find the similarities compelling and feel that, to some extent, the longer the market tracks the composite, the more compelling the argument that it will continue to do so.
Although the stock market may be mired in a longer-term secular bear market, it will experience significant rallies at times along the way. On several occasions during the 1930’s-40’s and 1970’s, the market exhibited rallies of 60% or more (of course, these rallies were merely making up for prior losses and/or would be erased in subsequent declines.) When we last updated the secular bear comparison chart above in early 2009, the current market was near its lows and in the “window” of time when the bear composite had bottomed out and begun a cyclical move upward. Obviously, the market has rallied since then and we have updated the secular bear comparison chart below.
(as of January 2011)
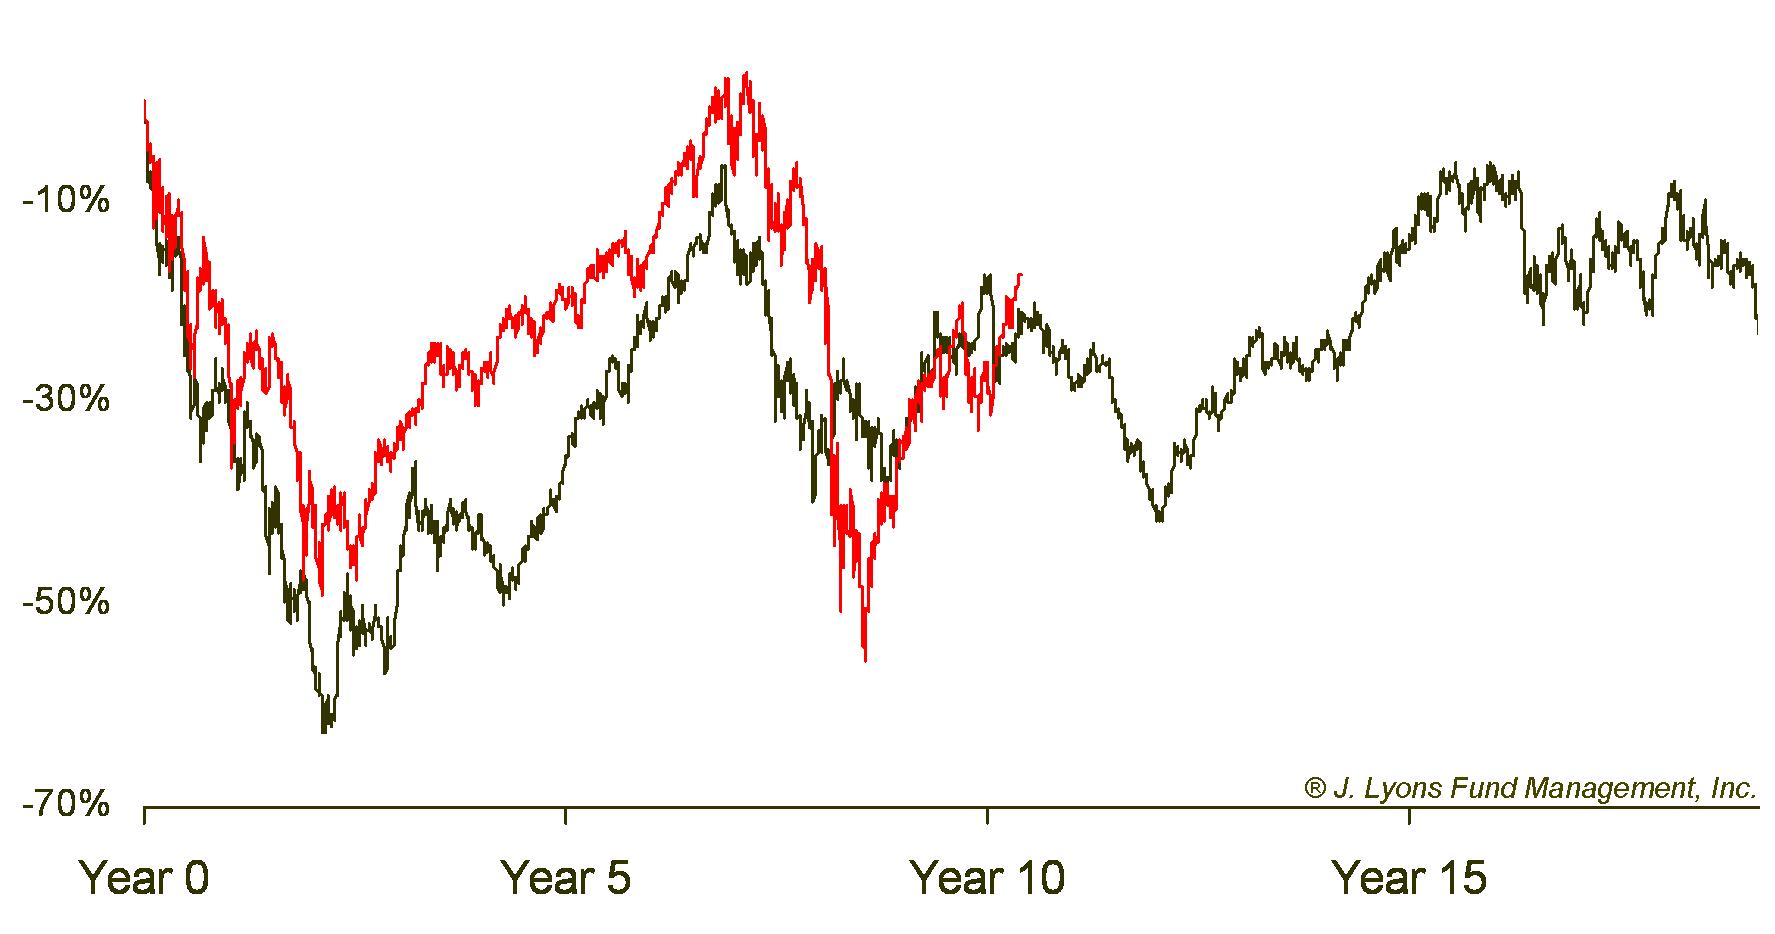
As the chart illustrates, the market has continued to track the composite very closely. Will it continue to do so? We obviously cannot promise that it will nor do we feel it is even significant to forecast it. It does, however, continue to give us confidence in our beliefs that 1) we are currently in a secular bear market, 2) the bear market will likely continue for the better part of the next decade and 3) it will continue to be a frustrating, not to mention, unprofitable, period for buy-and-hold investors.
How Much Upside Remains to the Current Rally?
The
bear market composite study makes for an interesting hindsight
observation. But outside of the general forecast for the next 8-10
years, what practical assistance can investors glean from it? We’ve
done a comparison of the current cyclical rally since 2009 and similar
rallies within prior secular bear markets to see how much upside it
suggests might be left to this rally.
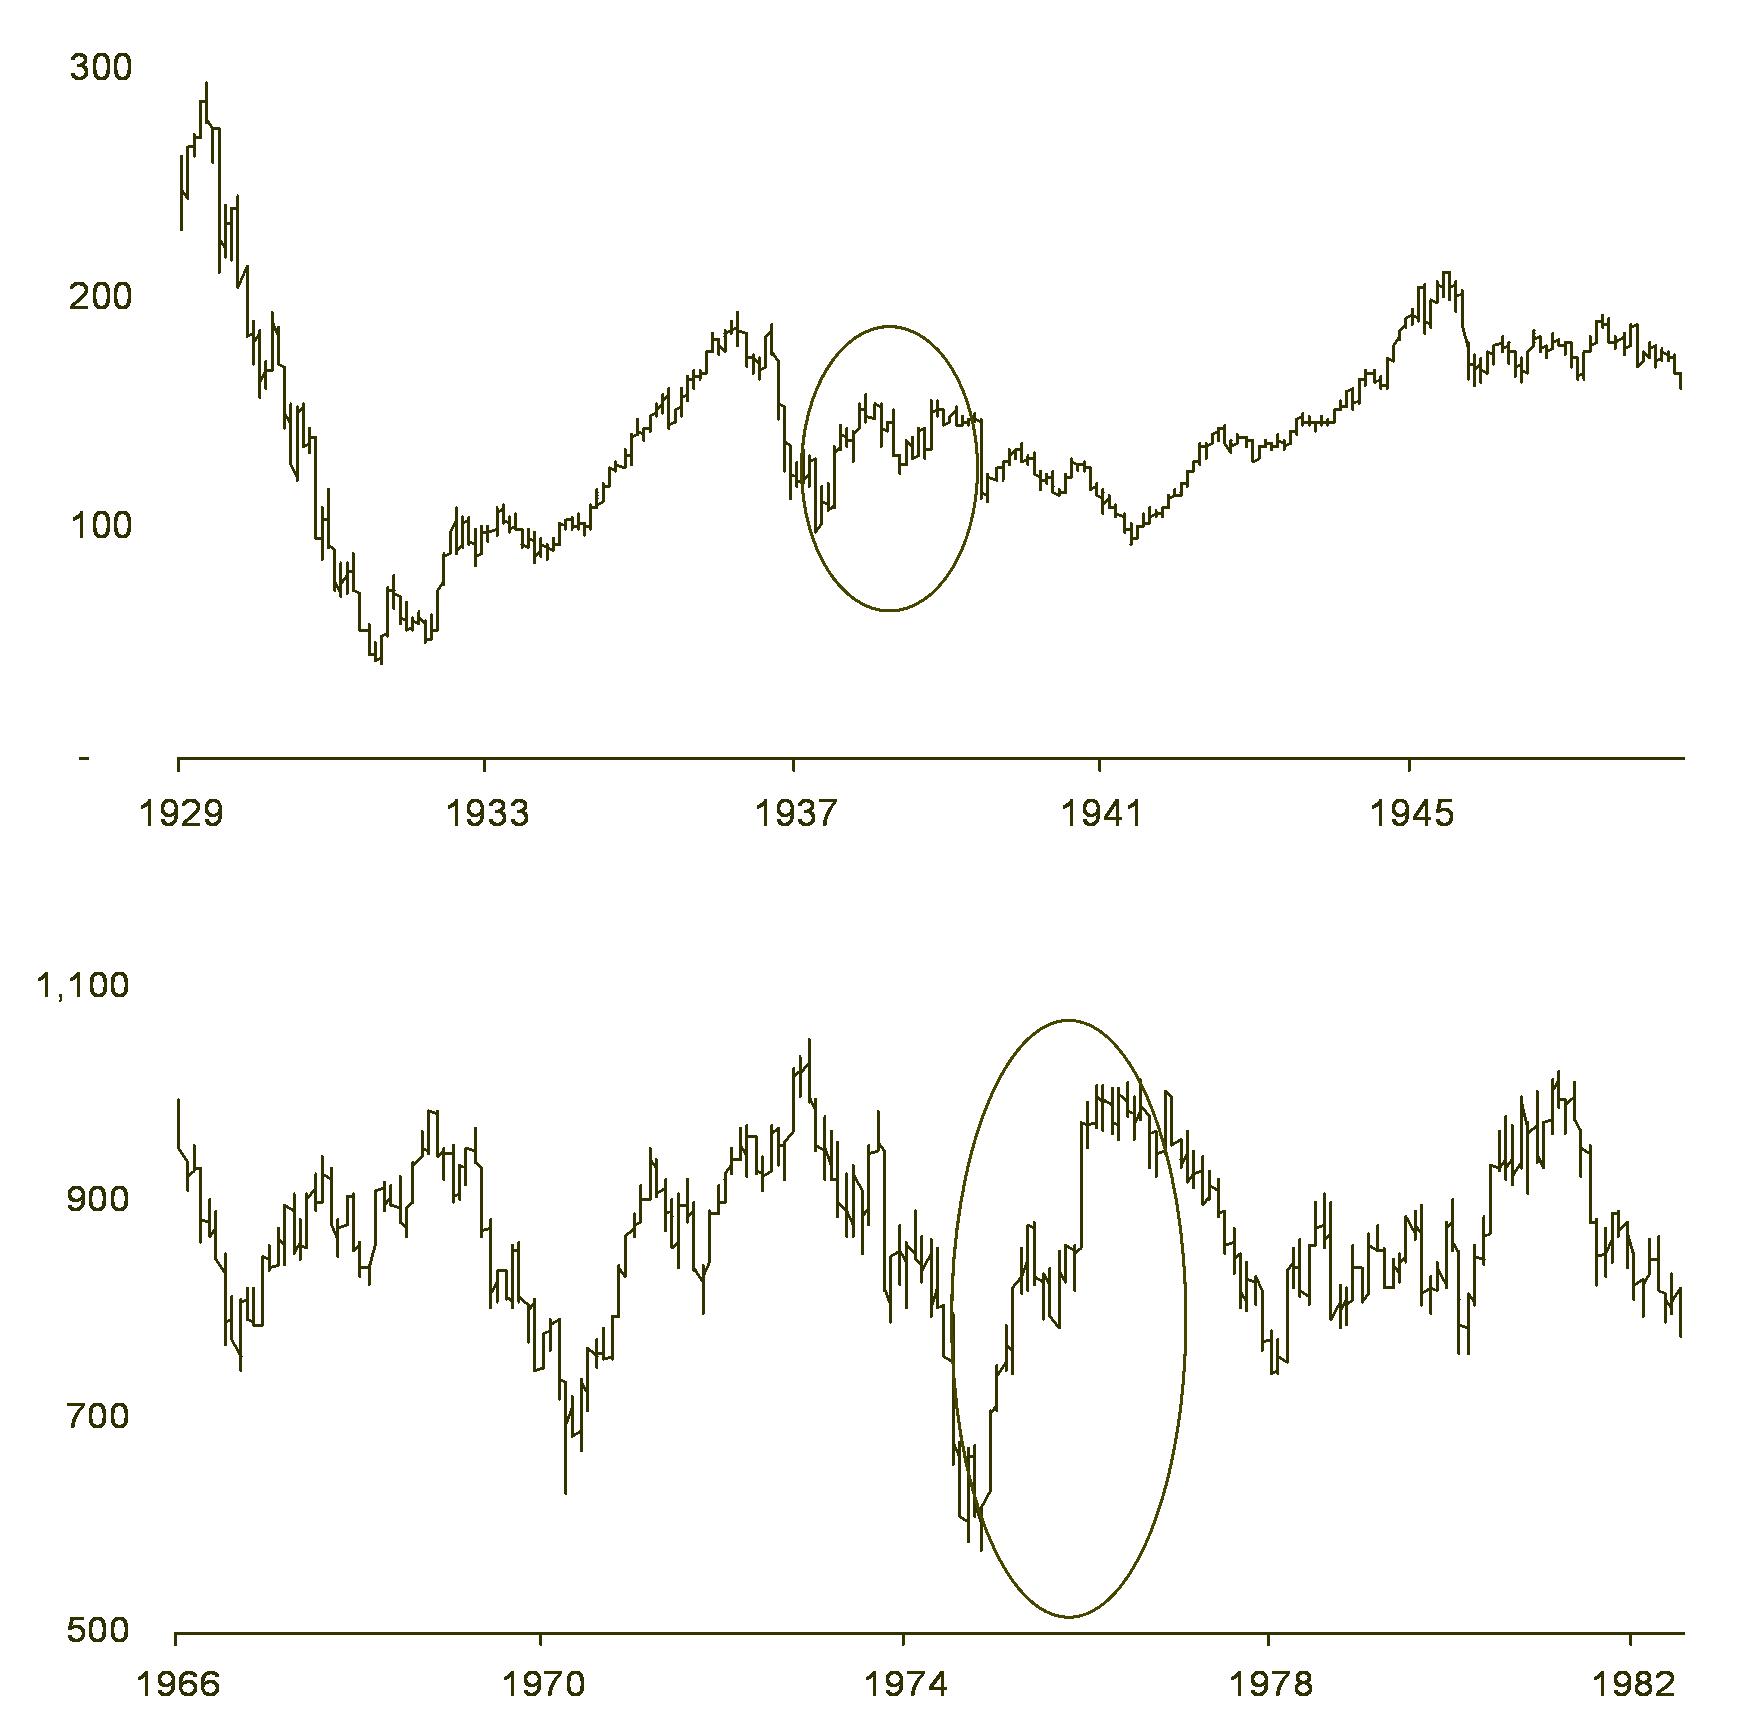
The current rally is
the second cyclical (shorter-term) bull rally within the ongoing
secular bear market (the first cyclical bull was the rally from 2003 to
2007.) By comparing this rally to “similar rallies within prior bear
markets,” we are referring to the second cyclical bull rallies from
prior secular bear markets, specifically the rallies that began in 1938
and 1974.
In
the table below you can see how the current rally compares to the
average of those rallies in duration, total return and percent
retracement of its previous decline.
Gain |
Duration |
%
of Previous Decline Recovered |
|
| Average
Rally (from 1930s and 1970s) |
66% | 18 months | 72% |
| Current
Rally (March 2009-January 2011) |
80% | 22 months | 69% |
As the table
illustrates, by historical standards the current rally has exceeded the
average second cyclical rally in all measures except in its retracement
of the previous decline (i.e., the decline from 2007 to 2009.) These
are, of course, merely averages. Furthermore, this market does not
have to correlate to past markets. However, markets do move in cycles
and history often can provide helpful guidance on what to expect -- if
using appropriate historical periods for comparison, which we believe
we are doing. Therefore, by this comparison, the current rally may be
getting a bit long in the tooth. At the very least, it is likely not
the
best time to be too aggressive in this market, particularly with
seemingly everyone else so quantifiably and exceedingly bullish.
What
to Expect After this Rally Ends?
What can investors expect from the stock market once this rally ends? From glancing at the chart of the Secular Bear Market Composite, it is clear that the market is likely to make very little progress over the better part of the next decade. On average, after the secular bear rallies ended in 1939 and 1976, stocks suffered a 25% loss sometime over the next few years. It then took an average of five years before the rally highs were broken. Furthermore, even after surpassing the rally highs, stocks remained in the general area of those highs three years after that. Therefore, on average, it took eight years from when the second cyclical rally ended before the stock market began to make sustainable gains for investors.
Applying these figures to the current market would put the S&P 500 and the Dow at around 971 and 8877, respectively, sometime in the next few years (using the recent highs of 1295 and 11,837.) And if the market follows the historical pattern, we won’t see new highs until 2016 and we won’t begin a new secular bull market until 2019.
| Post-Rally Loss |
Time until Rally High is Broken |
Time until Rally High is Permanently Broken | |
| Average
2nd Cyclical Rally (from 1930s and 1970s) |
-25% | 5 years | 8 years |
| Projections
for Current Market (Based on Averages) |
S&P
500: 971 Dow: 8877 |
2016 | 2019 |
Conclusion
To reiterate once again, the projections in the table above are not predictions. They merely reflect how the market would perform should it adhere to its historical average. The market could exceed the historical precedents and continue its rally this year, as it typically does in the third year of a Presidential Cycle. Then again, it may do worse (following the pattern of the ongoing secular bear market in Japan, for example, would imply future price targets of 450 for the S&P 500 and 4000 on the Dow!) However, we do strongly believe that the general sideways pattern indicative of a secular bear market will continue for several years to come. For investors hoping to make up for lost time due to the carnage of 2002 and 2008, don't hold your breath -- or your stocks. Buying and holding only guarantees another lost decade (or close to it) if the market holds true to its historical sideways form. Only by adopting some form of Active Management will investors have a fighting chance to make meaningful progress over the remainder of the secular bear market.
Dana Lyons
Vice President
| Tweet |
 |