| August/September 2011 |
Crash Course
A
historical look at stock market crashes
...and most importantly, what to expect post-crash
Contrary to academic teachings, much of the movement in markets is driven by emotion, namely fear and greed. Fear pushes prices down and greed pushes prices up. It has also been scientifically documented that the emotion of fear acts as a much stronger force on individuals than does greed. That explains why markets typically decline faster than they rise. And the ultimate fear-inducing declines are crashes. When market losses generate enough fear to drive investors to sell "at all costs", crashes are the result. Unfortunately, the emotions spurred by these events cause investors to start behaving irrationally. We would like to help investors recover their objectivity with this discussion on crashes, and in particular, the period following a crash. What should investors expect from the markets after a crash? Should they sell out now? Should they double down?
First, we would like to de-mystify the idea of crashes. Sure the crashes that occurred in 1929 and 1987 are outlier events and abnormal in every sense. However, the type of crash, or mini-crash, that recently occurred in late July-early August during which the markets fell roughly 15% in 2 weeks is not that uncommon. In fact using the criteria outlined later in this issue, we identified 58 such comparable crashes in the Dow Jones Industrial Average since 1920. That is one occurrence every 18 months, on average -- hardly uncommon.
One other point that we would like to make is that these crashes are not indefensible. Sure it is possible that a major event could cause an unforeseen crash. However, as we noted, typically there is a fair amount of weakness before the actual crash, especially in breadth if not in the price of the major averages (breadth refers to the number of stocks which are advancing versus those which are declining.) Our risk model (or timing model) relies heavily on measures of breadth to gauge the health of the overall market. This model has given a sell signal before each of the 12 crashes that have occurred since 1978 when the model was first employed. Thanks to those signals, we have been able to take action each time to defend against significant losses for our clients.
Unfortunately, the reality is that a crash, or mini-crash, has already occurred and it is too late to defend against it. Investors who failed to take measures to protect their portfolios are sitting with damaging losses for the past month -- not to mention the fact that most investors are unaware of when or how to protect their portfolios, or even that such protection can be applied. So what should investors do now?
First off, investors need to move past the crash and on to the next play. That move has happened and there is no use dwelling on it or obsessing with recapturing the losses Sulking is not a strategy nor is a default position of hope. Perhaps most importantly, ignoring the situation is not a strategy either. At a minimum, absorb and retain lessons from the crash, especially pertaining to managing risk, so that the same mistakes are not repeated in the future. To investors for whom this kind of volatility is too unnerving, and to investors for whom the vacillations of this 11-year old secular bear market have become too frustrating, this is our advice for the best long-term solution:
1) Find an advisor or manager with the ability to reduce your risk and minimize losses during serious market declines and who can demonstrate a track record of providing such protection.
2) Hire this person to manage your investments.
Post-Crash: What to Expect
So what can we expect market-wise now after such a crash? Anything can happen of course but the typical pattern in the near term is for the market to bounce for a few days before "testing", or dropping back down near, the crash lows. If the market is able to hold in the vicinity of the crash lows, it often embarks on a more significant multi-week rally before again testing the crash lows. What sort of actual returns can be expected, generally speaking? Like always, the best guide in determining the highest-odds outcome is to study similar crash-type moves throughout history. Specifically, it is most helpful to study similar crash-type moves from similar periods in the market cycle.
Crash Criteria
In order to find historical crashes with which to make comparisons, we first we need to define what constitutes a "crash". Such an endeavor involves a dose of subjectivity and thus brings to mind Justice Potter Stewart's observation on pornography -- it's difficult to define, but you know it when you see it. Those who witnessed the decline in October 1987 know what a true, hard-core crash looks like. In the recent decline, the market lost about 15% in two weeks. During the crash of '87 the market lost over 20% in one day. So whether or not the recent decline should be considered a crash is certainly up for debate.
However, strictly using the 1987 parameters to define a crash yields just one other precedent in the last century. That would not make for a very robust or useful comparison study. At a minimum, let's just define a crash as a swift and significant decline. Most reasonable minds can agree that the recent decline fits that description so for the purposes of this study, we are going to call it a crash. Besides, whether it was or was not a crash, the historical declines we used in the study were comparable moves to this one so the study is useful and relevant.
In
order to make comparisons, however, we do
need to define “crash” more specifically to allow us to identify
historical moves with which to make such comparisons. The first guide
in deciding what criteria to use to define a crash is the recent
"crash"
itself. After all, if we are not comparing declines similar to the
recent one, what good is the comparison in the first place? At the same
time, we also need
to allow for some variation since no markets moves are identical. In
addition we need to be able to come up with enough comparable
historical
moves to make the study worthwhile. Lastly we need to make sure that
the
few obvious and indisputable crashes throughout history fall under
whatever crash criteria we use.
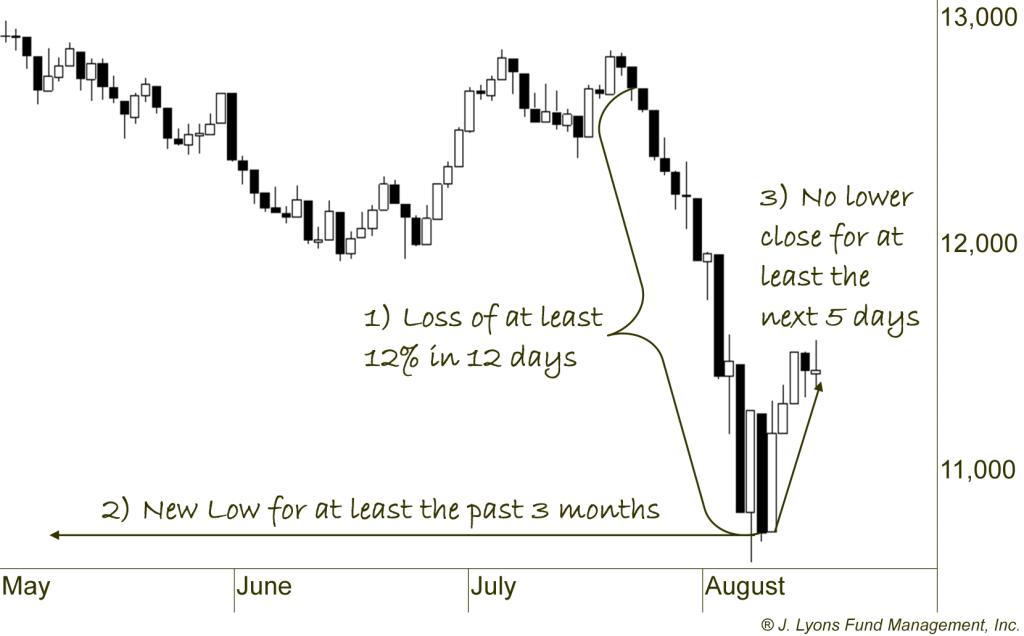
The following is what we decided on as "crash" criteria for this study:
- A market drop of at least 12% within 12 market days This rule filters out substantial yet more gradual declines as well as large drops that were merely 1-day wonders. While some may argue that a true crash happens in a just day or two, we feel that these parameters fit the description of a “swift and significant” decline. A 12% loss in 12 days will most likely elicit the feeling of panic associated with crashes. Many of these moves historically have seen much of the losses occur in the last few days of the decline when panicked investors simply want to get out at all costs. Indeed the few “true” crashes have begun as smaller declines over the course of a week or two before their eventual spectacular one or two day crashes.
- A move to at least a 3-month low This parameter accomplishes two things. First, a 3-month low is a sign of significant market damage. Psychologically, such a move that violates all near-term technical support levels is unnerving to investors and traders and would elicit the heightened emotion and fear associated with crashes. Secondly, this eliminates rebound days after initial crash lows from being counted in our study even if they meet the first rule.
- No lower closes for at least 5 days Similarly, this rule simply prevents consecutive days in a prolonged decline (see 1929-32 and 2008-09) from being counted as crashes in our study. We only want to count the end, or the temporary end, of the crash in our study in comparison with the August 10 low. Whether or not the market goes on to make a new low, we now know that it held for at least 5 days so we want to compare similar historical moves. For markets that went on to violate the initial low after 5 days and still satisfied rules 1 & 2, we counted them as separate crashes. So, according to our study’s parameters, there were periods, mostly in the early 1930’s, that saw successive “crashes” in close proximity to each other.
Post-Crash Returns
Using this criteria, we can identify 58 “crashes” in the Dow Jones Industrial Average since 1920. It may seem somewhat surprising that, on average, the market has demonstrated very positive returns post-crash.
| 1
Month Later |
3 Months Later |
6
Months Later |
1
Year Later |
2
Years Later |
|
Average Post-Crash Return (58 occurrences) |
5.7% | 9.1% | 7.0% | 9.7% | 19.0% |
Average Return for All Such Periods |
0.6% |
1.7% |
3.5% |
7.3% |
15.0% |
| J. Lyons Fund Management, Inc. | |||||
For each of the periods measured, on average, the post-crash
markets turned in far superior returns than normal, particularly in the
near term. Before you rush to double down or leverage your stock
positions, however, there is more to the story. The key phrase is on average.
Post-Crash Returns and the Secular Market Cycle
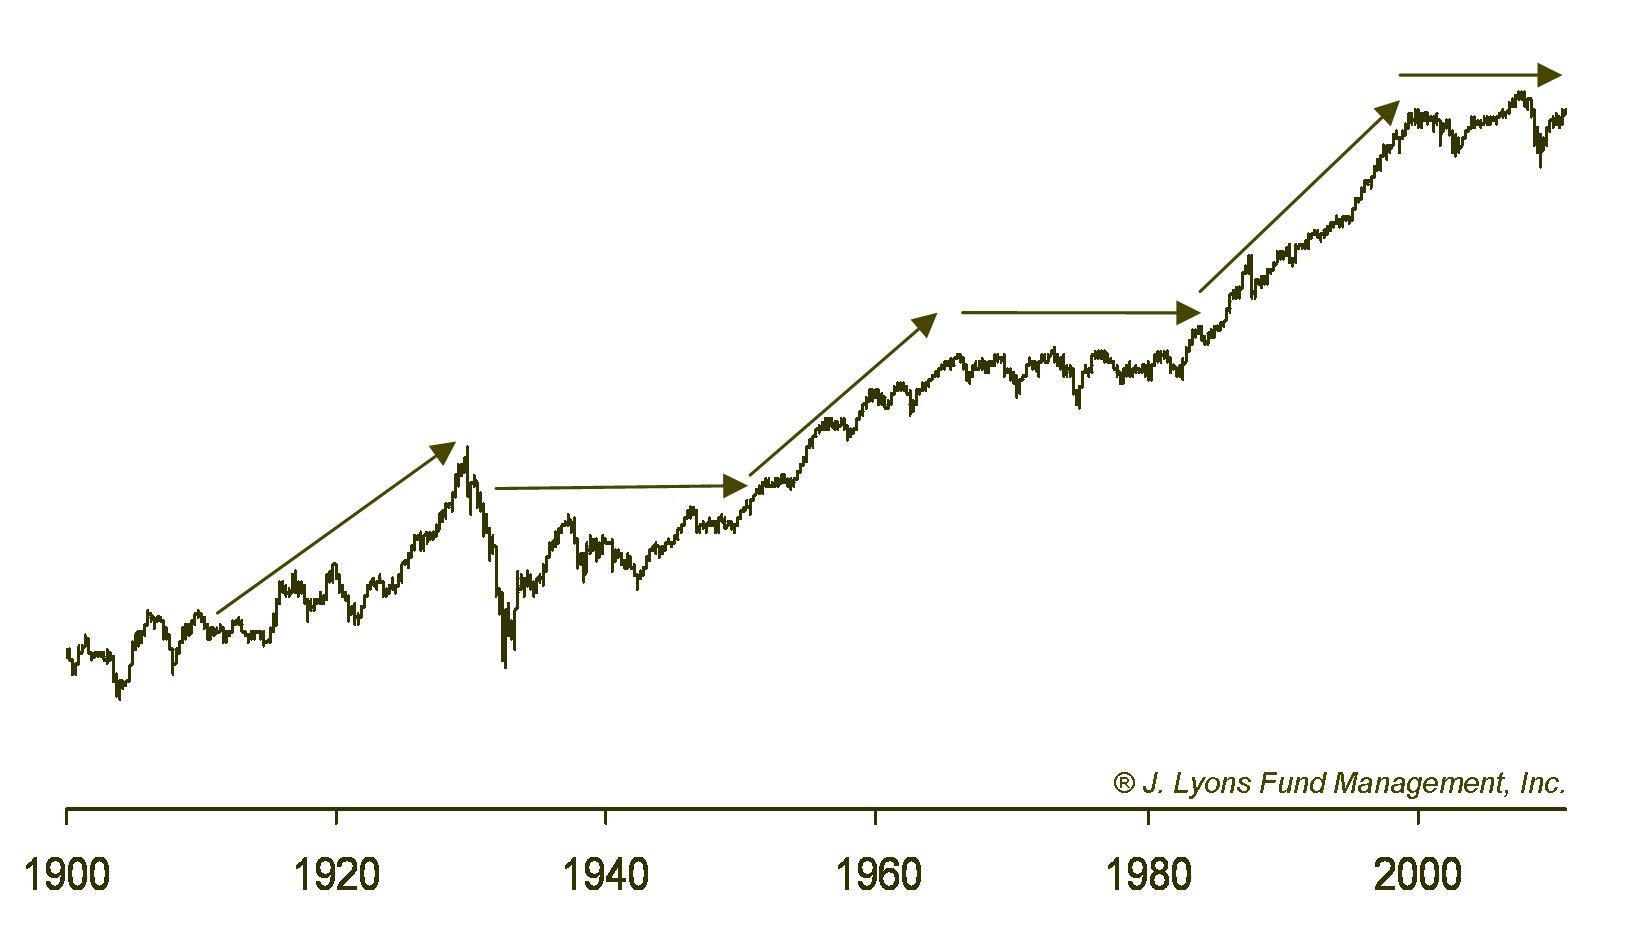
Since we believe the best and perhaps only truly useful comparisons are those made with similar periods in a market cycle, we broke the post-crash returns down further. We have noted on many occasions that the stock market has historically alternated between secular bull markets (where the market rises) and secular bear markets (where the market moves sideways or lower). Since 1900, each part of the secular cycle has averaged about 18 years in duration.
As many readers of our market analysis are aware, it is our thesis that we are currently in a secular bear market that began in 2000 (by the way, after 11 years and down 25% from the highs in the S&P 500 and 50% in the Nasdaq, is it really still just a thesis?). As such, it is more appropriate to compare the current post-crash market with others that occurred during secular bear markets. Here are the post-crash returns broken down by secular bull and bear markets.
| 1
Month Later |
3 Months Later |
6
Months Later |
1
Year Later |
2
Years Later |
|
Average Post-Crash Return in Secular Bull Markets (16 occurrences) |
4.8% | 8.9% | 15.4% | 20.0% | 36.0% |
Average Post-Crash Return in Secular Bear Markets (42 occurrences) |
6.0% | 9.2% | 4.2% | 6.3% | 13.3% |
| J. Lyons Fund Management, Inc. | |||||
As can be seen, things aren’t so cut-and-dry positive anymore.
The
post-crash returns during secular bull markets are exceedingly positive
on all
time frames. However, while strong in the nearer term
during secular bear markets, the longer-term returns are below average.
Furthermore, practically all
of the 1-year gains are made in the first month alone. And after a
strong 3-month performance, the market, on average, moves lower for the
remainder of the year.
So while the longer-term
prospects are not too bright, perhaps it appeals to you to at least
double down in the short-term?
Well, it’s still not that easy. The road to those short-term
gains is not always so smooth. Let’s consider drawdowns.
Post-Crash Drawdowns and the Secular Market Cycle
Drawdown is typically the measure of loss from the high point to the low point during a certain period. In this case, we are measuring the largest loss below the crash low that occurred during each subsequent period. We've broken down the drawdowns again by secular bull and bear market.
| 1
Month |
3 Month |
6
Month |
1
Year |
2
Year |
|
Average Post-Crash Drawdown in Secular Bull Markets |
-2.0% | -2.1% | -2.7% | -4.6% | -4.8% |
Average Post-Crash Drawdown in Secular Bear Markets |
-3.4% | -7.5% | -13.8% | -21.0% | -28.8% |
| J. Lyons Fund Management, Inc. | |||||
As you can see, the drawdowns during
secular bull markets were minimal on all time-frames. On average, the
market dropped less than 3% below the crash low at any
point during the 6 months following the crash. Even more impressively,
on average it fell less than 5% below the crash low at any point over
the following 2 years. Therefore, it really has paid to “buy the
dips” after crashes in secular bull markets.
It has been a whole different story during secular bear markets. Even in the short term when the average post-crash returns were robust, the drawdowns were significant. For example, to achieve the average post-crash 3-month return of 9.2%, one had to first put up with an average loss of 7.5%. Therefore, those short-term positive returns did not come without some pain in the interim. And on a longer-term basis, although the average returns were somewhat flat, there was some serious pain doled out along the way.
Post-Crash Returns and the Cyclical Market Cycle
Lest you look at the sub-par yet positive 1-2 year returns and think it an advisable strategy to repeatedly double down into post-crash declines, it is important to remember that these are just averages. On several occasions, the post-crash declines were not merely drawdowns but declines that never recovered within those 1-2 years. Some post-crash markets subsequently kept moving lower for several more years. On the other hand, some crashes during secular bear markets ended up marking the low or near-low for the decline and led to robust multi-year rallies. So what distinguishes those crashes that lead to even greater losses with those that occur near the end of declines?
One factor that struck us as relevant was the timing during the cyclical cycle in which a crash takes place. (The cyclical cycle is the shorter-term cycle that comprises the ups and downs in the market within the longer-term secular cycle.) We separated the secular bear crashes into 2 categories: those that began near a cyclical top (i.e., 52-week market high) and those that began with the market well below that cyclical top.
Based on Cyclical Market Position
| 1
Month Later |
3 Months Later |
6
Months Later |
1
Year Later |
2
Years Later |
|
| Average Post-Crash Return when crash begins more than 10% from 52-Week High (26 occurrences) | 7.7% | 11.2% | 3.2% | 10.1% | 19.9% |
| Average Post-Crash Return when crash begins within 10% of 52-Week High (16 occurrences) | 3.0% | 5.8% | 6.0% | -0.3% | 1.6% |
| J. Lyons Fund Management, Inc. | |||||
Crashes which began when
the market was well below a 52-week high tended to occur later in the cyclical decline.
These markets tended to be more "oversold" on a longer-term
basis
and thus more prone to turning around to the upside. As shown, forward
returns after these
crashes were very positive on all time frames.
However, those crashes that began while near a 52-week high tended to mark the beginning of a longer-term decline. In these instances, much more damage needed to done in the market before it became "oversold" and was able to put in a lasting low. Thus, after the typical, albeit smaller than average, short-term bounce, these crashes led to extremely poor longer-term returns.
So which category does the recent crash fall into? The move into the crash began on July 22, with the Dow trading within 1% of its 52-week high set on May 2 -- and the high of the 2-year rally since March 2009. Therefore, the current crash falls into the category of secular bear crashes that began within 10% of the 52-week high.
This is not great news for investors since historically, these crashes tended to mark the beginning of new longer-term declines. If that is the case, this is very bad news indeed for investors whose strategy is to simply "buy and hope" that the market will inexorably move upward and they can recover their losses. It’s potentially especially bad news for investors planning on doubling down here in the hopes that the “buy the dips” strategy is the way to go. This strategy will only lead to greater losses if we are indeed in the beginning stages of a move lower over the next few years. And we must add that in general, for those investors whose strategy, eleven years into a secular bear market, continues to be some combination of paralysis, lethargy, and plain ignoring the overriding investment climate that is with us and will continue to be for some years to come, it will be quite painful.
Conclusion
Unfortunately, crashes are a reality in stock investing. The good thing, as evidenced by our risk model's warnings, is that crashes have historically been telegraphed enough to allow investors to take preemptive defensive measures to mitigate the damage. However, when investors fail to protect their portfolios during a crash, it literally can take years to recover the losses. To make matters worse, those investment losses are invariably followed by a loss of perspective. Such loss can lead to irrational investment behavior and either further losses or missed opportunities.
If historical trends hold, the fact that the recent crash occurred during a secular bear market and near a cyclical high in the market will make things exceedingly difficult for those investors hoping to recoup their losses. For investors attempting to navigate this post-crash market, above-average returns out to 6 months following similar crashes have historically been the norm, though the path to those returns has often been rocky. That has typically been the extent of the post-crash gains, however. After the 6-month bounce, stocks have actually fallen, on average, over the next 18 months.
For investors that have grown weary of repeatedly taking these damaging losses over the past 11 years and/or those investors unequipped to guard against such losses, we will repeat our recommendation: hire an investment advisor or manager with a plan for and a track record of providing protection against such losses. Avoiding those losses, after all, should be your first rule of investing.
Vice President
Copyright (C) 2011 J. Lyons Fund Management, Inc. All rights reserved.