| April 2011 |
Sell in May and Go Away?
Just
how effective is this well-heard stock market adage
...and should the strategy be deployed this year?
Last month we studied the Presidential cycle, one of the few seasonal patterns in the stock market that has been consistent enough historically to be worth studying. This month we look at another consistent pattern, the phenomenon known as “Sell in May and Go Away”. As the name implies, the pattern reflects the tendency of the stock market to perform much better during the winter months, specifically from November through April, than it does from May through October.
There are many theories, plausible and otherwise, which attempt to explain the phenomenon. However, the relevant fact is that, like the Presidential cycle, there is substantial evidence that such a pattern does indeed exist and is consistent enough to be useful to investors. It isn’t just another inane Wall Street mantra with some vague correlation to the winner of the Super Bowl or the length of this season’s fashionable skirts.
Since 1900, the Dow Jones Industrial Average has sported an average return from November 1 through April 30 of 5.34%. Conversely, the Dow’s average return from May 1 through October 31 is 1.67%. That may not seem like earth-shattering stuff; however, the difference between the annualized returns of the two periods of more than 7% (10.7% vs. 3.3%) can have an extraordinary impact over time.
| Average Return | % of Years Positive | |
| November 1 - April 30 | 5.34% | 68% |
| May 1 - October 31 | 1.67% | 62% |
A few years ago, The Stock Trader’s Almanac did a study of the impact the Sell in May phenomenon can have on investors. They calculated that beginning in 1950, by investing 100% in the Dow between November 1 and April 30 every year then switching 100% into bonds between May 1 and October 31 every year, a $10,000 investment would have grown to $544,323 by the year 2005. Alternately, investing 100% in bonds between November and April and switching into the Dow between May and October would have turned a $10,000 investment into $9,728. The contrast between returning 5400% on your investment over 50-plus years versus losing money over that time is earth-shattering stuff…at least in the investment world.
In this Newsletter issue, we take a look at various angles to the Sell in May and Go Away phenomenon for hints of what the market may have in store over the next six months.
Sell in May and the Secular Market Cycle
We first looked at the Sell in May pattern in the context of the secular market cycle. As long-time readers and clients have become aware, throughout its history the stock market has repeated a cycle of alternating boom and bust periods, each lasting approximately 15-20 years. During boom periods, or secular bull markets, the stock market rallies and during bust periods, or secular bear markets, the market moves sideways to lower. We are currently in the midst of a secular bear market which began with the dot.com bubble bursting in 2000.
Secular Bull Markets
| Average Return | % of Years Positive | |
| November 1 - April 30 | 8.38% | 78% |
| May 1 - October 31 | 4.83% | 71% |
| Average Return | % of Years Positive | |
| November 1 - April 30 | 2.94% | 60% |
| May 1 - October 31 | -0.87% | 54% |
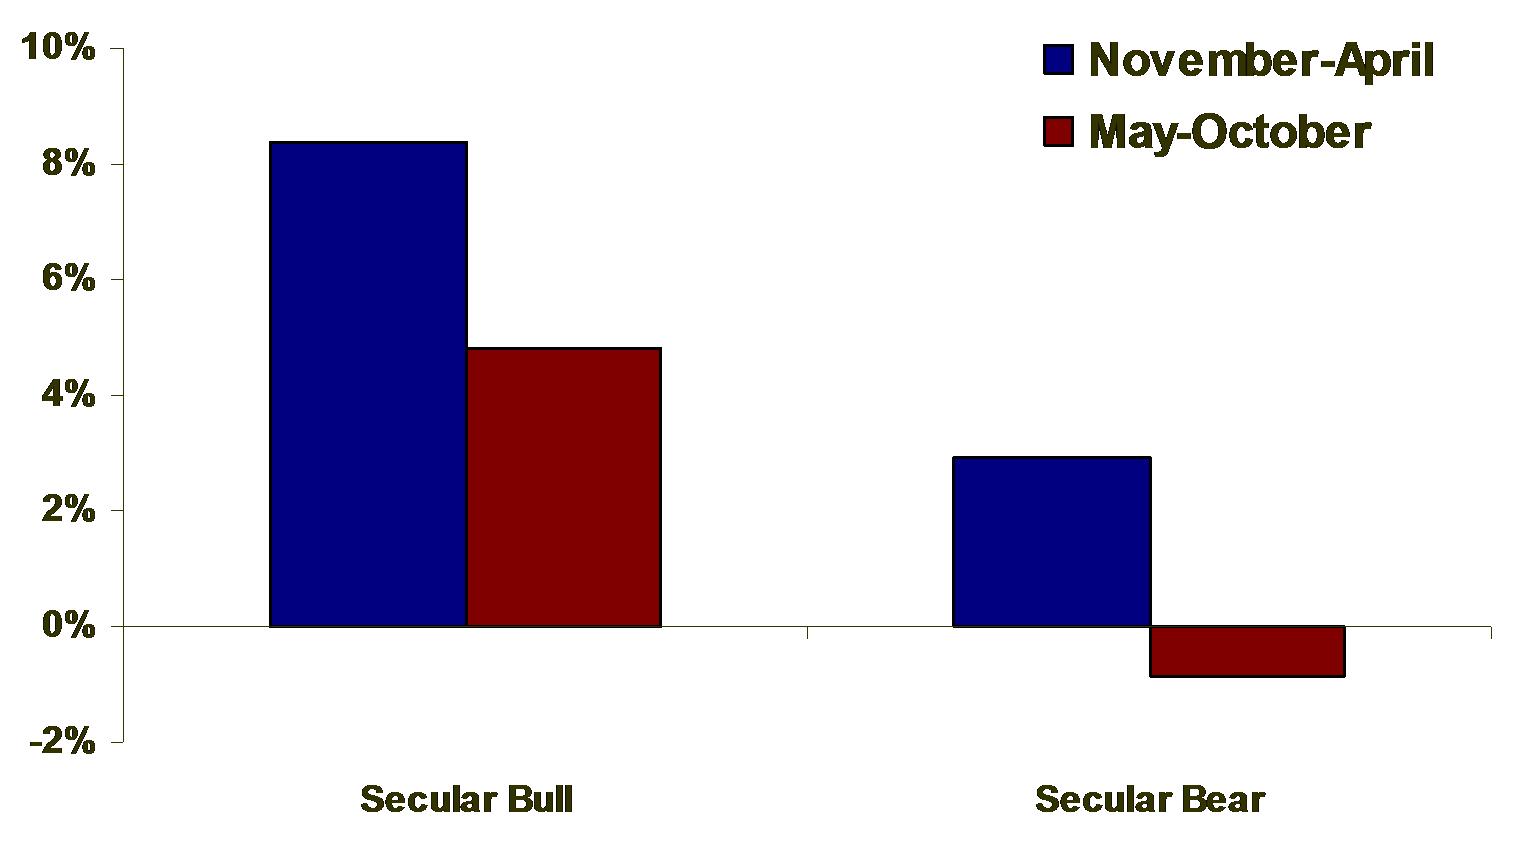
Naturally, the type of secular market environment that exists can have a substantial impact on the behavior of stock prices and patterns. So it is no surprise that during a secular bear, stocks perform more poorly on average during both the November-April and May-October periods. It is interesting that the spread between the November-April and May-October periods is similar in both bull markets, 3.55% (8.38%-4.83%) and bear markets, 3.81% (2.94%--0.87%). This demonstrates the consistency of the Sell in May pattern.
For the upcoming May-October period, the fact that not only is the average return in bear markets during those months about 2.5% worse than the average in all years, it is actually negative at -0.87%. Therefore, though May-October sees positive returns 54% of the time during bear markets, we'd have to consider the condition of a secular bear market a negative for the market's prospects over the next 6 months.
Sell in May and the Presidential Cycle
Last month we studied the stock pattern known as the Presidential cycle and illustrated that the market tends to perform differently during each of the four years during a President's term. Specifically, since 2011 is the 3rd year of the current Presidential cycle, we noted that 3rd years tend to be the strongest of the four years. However, we also discovered that the performance in 3rd years was significantly weaker during secular bear markets than during secular bulls. This month, we look at the impact of the Presidential cycle on the Sell in May phenomenon.
Year 1
| Average Return | % of Years Positive | |
| November 1 - April 30 | 4.72% | 61% |
| May 1 - October 31 | 0.50% | 64% |
| Average Return | % of Years Positive | |
| November 1 - April 30 | 3.48% | 64% |
| May 1 - October 31 | 0.00% | 54% |
| Average Return | % of Years Positive | |
| November 1 - April 30 | 10.75% | 82% |
| May 1 - October 31 | 1.57% | 59% |
| Average Return | % of Years Positive | |
| November 1 - April 30 | 2.31% | 63% |
| May 1 - October 31 | 4.72% | 70% |
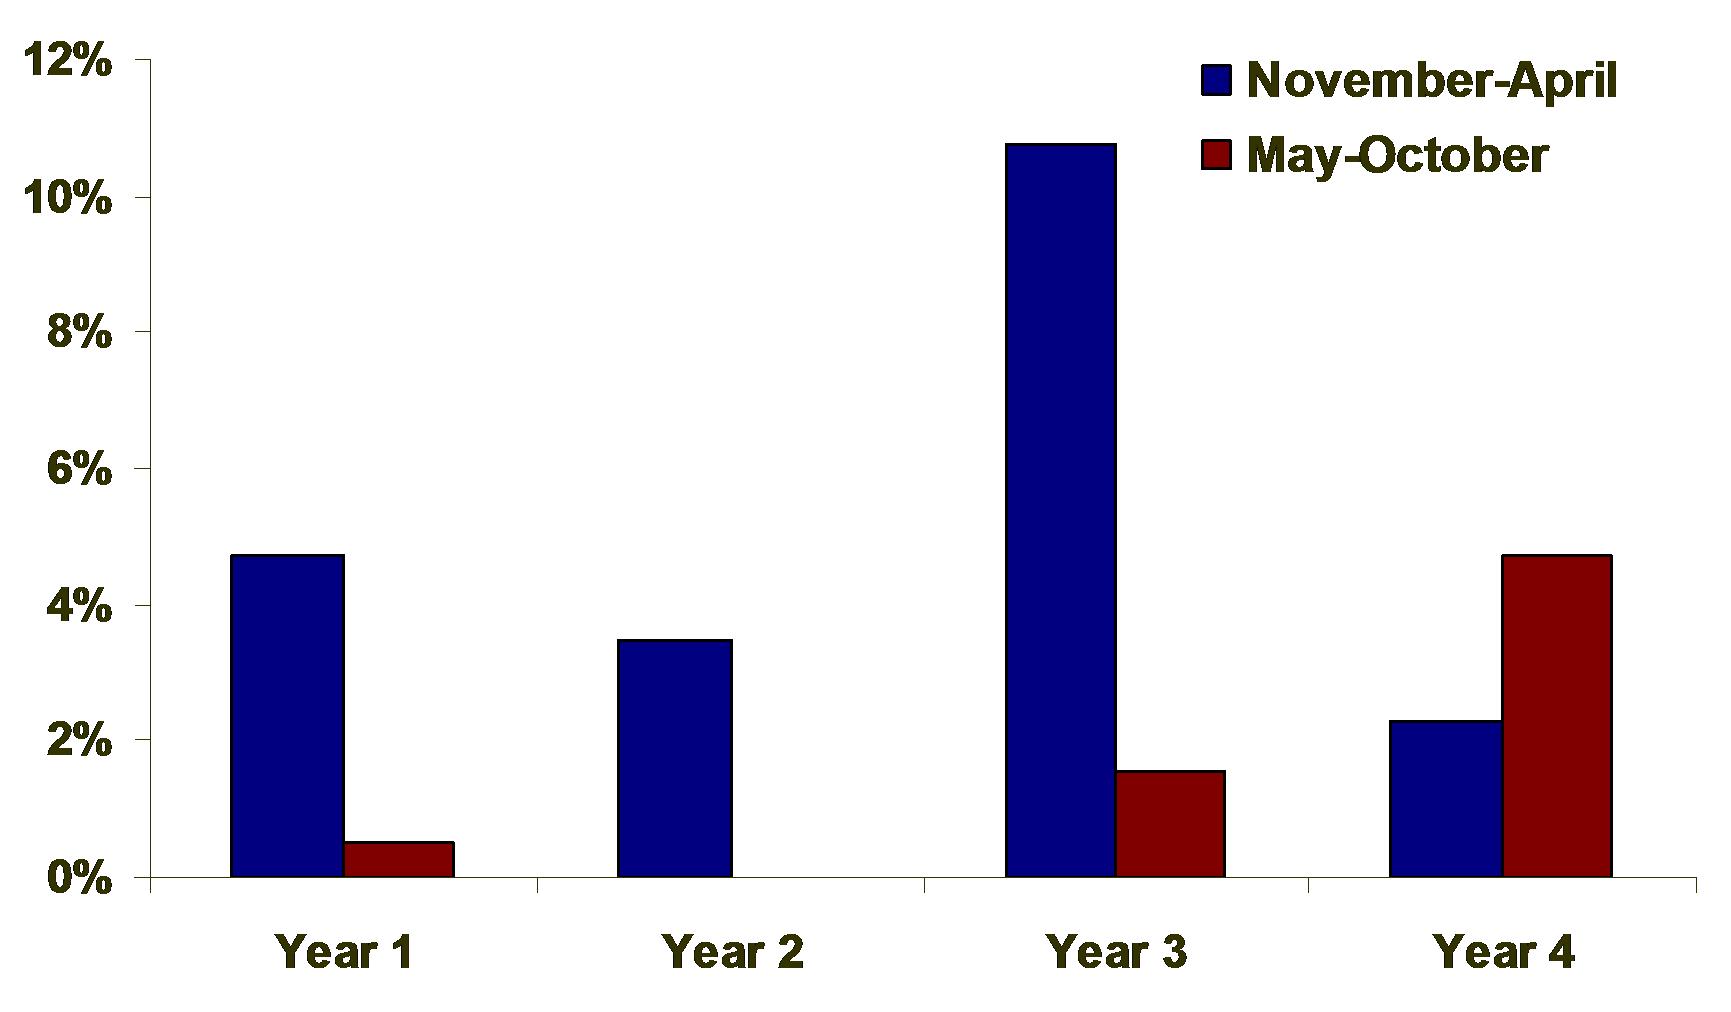
As
the full-year figures would suggest, the average November-April return
during Presidential 3rd years is very strong. In fact, at 10.75%, it is
double the overall average for November-April and more than double that
of any of the other year individually. Interestingly, as of the issue date of this
newsletter, the November-April return for the current year is 10.3%, right near the long-term average. Unfortunately, this period
ends at the end of this month so it really doesn't help investors at
this point.
What does it say about expectations for the upcoming April-October period? As it turns out, not much. The average May-October return for Presidential 3rd years is 1.57%, right at the average May-October return for all years. That means the entire outperformance in 3rd years of the Presidential cycle occurs during the November-April time period -- a good thing to keep in mind 3 1/2 years from now.
One other interesting pattern here is the behavior during Presidential 4th years, i.e., election years. This is the only data series that we have looked at thus far in which the May-October period is stronger, on average, than the November-April period. The cynics in us wonder if that has something to do with Presidential candidates trying to outdo each other with voter-friendly and market-friendly rhetoric leading up to the November election...but we'll leave that for others to debate.
November-April
Returns Predictive of May-October Returns?
Perhaps the performance of the November-April periods can be predictive of subsequent May-October returns. Does the market have a tendency to continue its trend through the summer months or is it more likely to be mean-reverting? When considering merely the direction of the market's November-April return (i.e., up or down), the market does tend to continue its trend through the May-October period. Furthermore, there is a wide disparity between the average returns for May-October based on whether the November-April period was positive or negative. If November-April was positive, the subsequent May-October average return was nearly 4% while following a negative November-April period, May-October averaged a loss of over -3%. A difference of 7%, or 14% annualized, is a significant spread.
| Average Return | % of Years Positive | |
| After Positive November - April | 3.99% | 69% |
| After Negative November - April | -3.08% | 47% |
We
drilled down further to see if the size of the gain or loss during
November-April made a difference in the subsequent May-October returns.
Below is a chart of returns for the two periods for each year from 1900
to 2010. The chart is ordered from left to right by the worst November-April return (blue
line) to the best, and the corresponding May-October return (red line)
for that year.
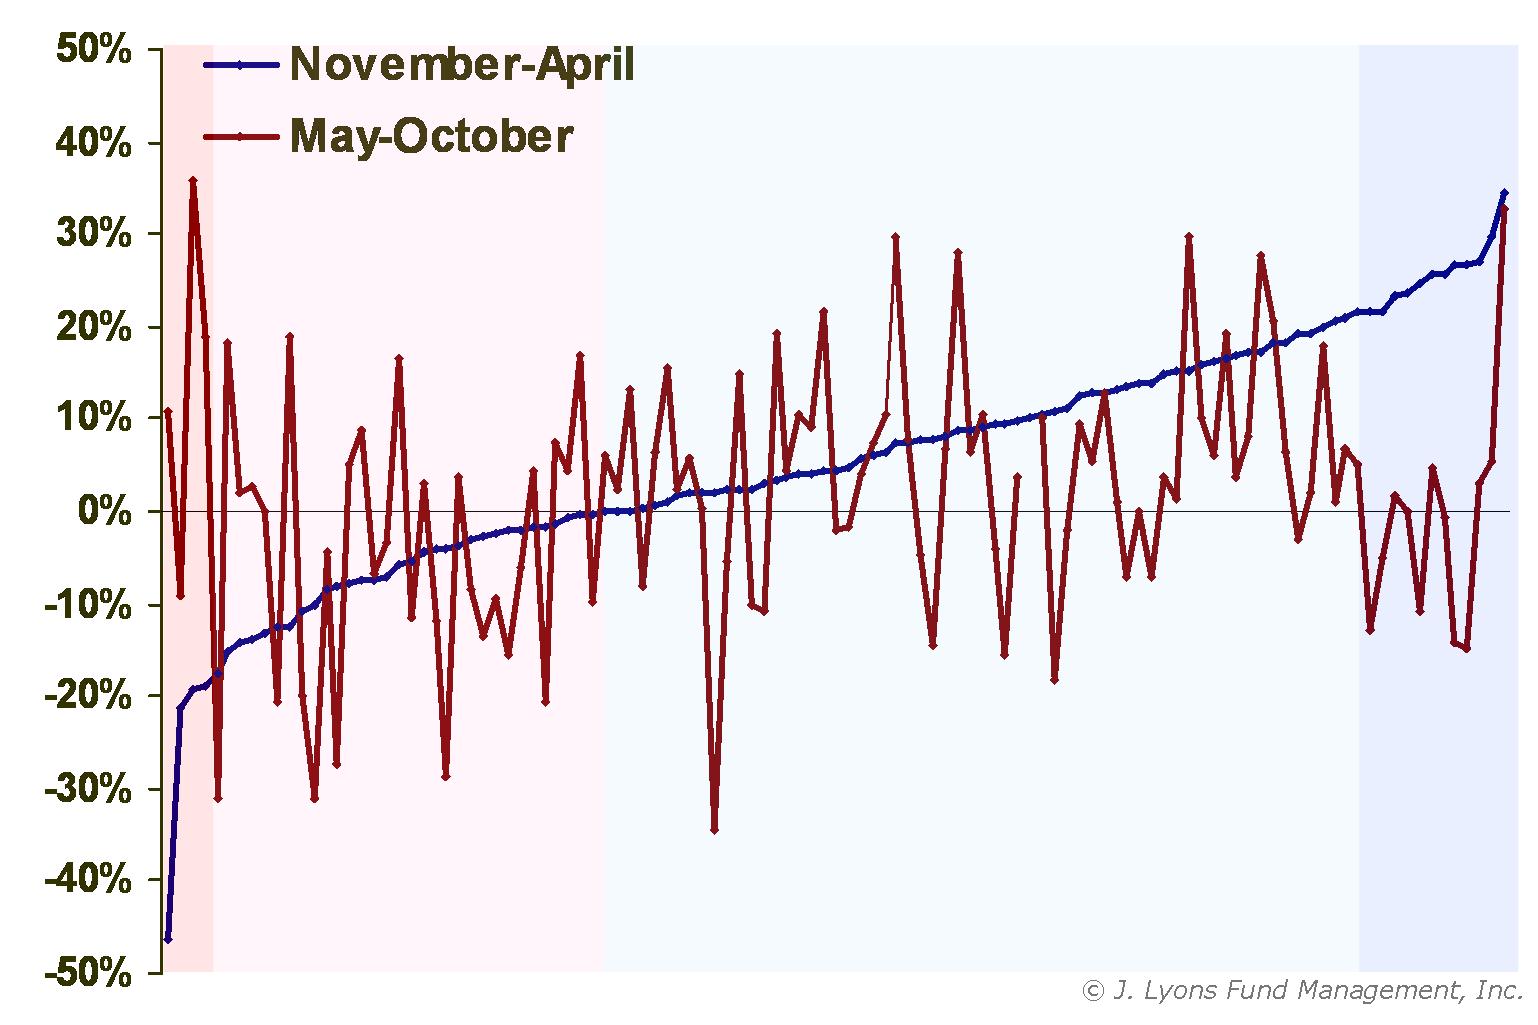
It's a little tough to discern from looking at the chart, but it's not simply a matter of whether November-April is positive or negative that impacts the subsequent May-October period. The size of the November-April gain or loss is also significant relative to subsequent May-October returns, as well as whether the market continues its trend or mean-reverts.
If the market sees moderate gains during November-April, it tends to continue its uptrend through May-October. Likewise, if the market experiences moderate losses during November-April, it tends to continue its losing trend through May-October. However, when the market makes outsized gains or losses during the November-April period (approximately 20% or greater either way), it tends to be more mean-reverting in the subsequent May-October period and reverse direction. The table below quantifies these tendencies, with the various colors matching the corresponding data on the chart above.
| Average Return | % of Years Positive | |
| After Outsized November-April Loss (< -19%) | 14.11% | 75% |
| After Moderate November-April Loss (0 - -19%) | -5.23% | 44% |
| After Moderate November-April Gain (0 - 20%) | 4.97% | 73% |
| After Outsized November-April Gain (> 21%) | 0.11% | 53% |
Clearly when the market makes an extreme move during the November-April period, a snapback in the other direction can be expected during May-October. During the vast majority of years, however, moderate moves are the norm for November-April. And based on the data, after moderate moves the market has a tendency to continue to trend in the same direction.
As mentioned earlier, the current November-April return is around 10% and thus falls squarely in the middle of the moderate gain category. Considering the run that the market is on, it feels like it's up by more than that. However, the 11% gain during last September-October is not included in the November-April period. It is just as well since including the September-October gain would push the market into the outsized gain category and suggest minimal upside in the upcoming May-October period. As it stands, the current moderate November-April gain bodes well for the market since it has preceded an average May-October historical return of 4.97%.
Conclusion
The first point to be made is that unequivocally yes, the "Sell in May and Go Away" pattern does exist. At least, historically it has existed and there can be no disputing the statistics. Both the general statistics that investors have been aware of for many years now as well as those that we have discovered and added to the discussion here not only make for interesting commentary, they are statistically significant. Why certain segments of the investment community dispute or dismiss the pattern is a mystery. Perhaps it doesn't serve their agenda or perhaps they just don't know how to make use out of it.
When it comes to the actual "Sell in May and Go Away" half of the yearly pattern (i.e., May through October), what use can we make out of it? Is it even worth incorporating what we know about that period into an investment strategy? As we have seen, stock returns during May-October can vary based upon certain prevailing conditions relating to cycles, recent performance, etc. Overall though, at an average return of 1.67%, stocks do consistently underperform over those six months. Does that tendency to underperform mean investors should necessarily sell in May and go away until November? After all, the average returns are still positive over the period so an investor is not losing money.
One factor to keep in mind is risk. Yes, the May-October returns are, on average, positive but an equity investor will be enduring significant risk to achieve those returns. Even in a low-volatility climate, there is always an elevated level of risk involved in equity investing. Even if one achieves the 1.67% return over the period, the risk-adjusted return will be much less. It would be better to invest in short-term bonds, for example, during the period, even at the current low yields. The return would be slightly less perhaps but the investment risk would be substantially removed so that the risk-adjusted return would be more favorable.
Additionally, with inflation beginning to creep up (or soar up, according to some metrics), the possibility that one's investment returns fail to keep pace with prices in general is a valid concern. A 1.67% return for six months could be completely eroded by inflation, particularly in a hyper-inflationary environment that many are calling for. That is not necessarily our forecast but it is a valid concern. In such a scenario, of course, investors would need to locate higher-yielding investment sources to keep pace with inflation. That may be difficult to find in the U.S. equity market if it remains in a secular bear market for several more years as we believe is likely.
Lastly, what does our research indicate about the prospects for stocks over the next six months? Should investors sell in May and go away or could 2011 be an exception to the rule and provide investors with returns better than the 1.67% historical average? Taking cues from the studies outlined above may provide the answer.
From the secular market study, we learned that the average May-October return during secular bear markets is -0.87%. The Presidential cycle stats indicate that the 3rd year of the cycle historically yields an average return of 1.57% during the May-October period. And a moderate gain made during the November-April period, as has been the case this year, has led to an average return in the subsequent May-October period of 4.97%. Average those returns, -0.87%, 1.57% & 4.97%, and you get 1.89% -- pretty close to the historical average for all May-October periods of 1.67%. Oh well, sometimes there's as much value in the journey as there is in the destination.
Dana Lyons
Vice President