| March 2011 |
Beware the Ides of April
The 3rd year of the Presidential Cycle is widely known to be the strongest one for stocks. However, there is an April phenomenon that has foreshadowed the success or failure of that axiom for a given year...with uncanny accuracy.
Many readers are probably somewhat aware of the Presidential cycle relating to the stock market. This cycle has historically exhibited a pattern of behavior whereby the stock market has a tendency to be strong during certain periods of a President’s term and weaker during others. For whatever reasons, it is one of the more consistent seasonal patterns pertaining to stock market behavior.
For followers of the cycle, it is well known that the 3rd year of the Presidential cycle is the strongest, and the figures certainly bear that out. In fact, in a recent newsletter, we mentioned that one factor which may outweigh some of the negatives currently overhanging the market is the consistent strength in the 3rd year of the Presidential cycle. However, there is one significant caveat to that distinction that we have discovered in our research.
First the numbers:
Presidential Cycle Dow Jones Performance - 1900-2010
| Presidential Year | Average Return | % of Years Positive |
| Year 1 | 5.8% | 52% |
| Year 2 | 4.2% | 59% |
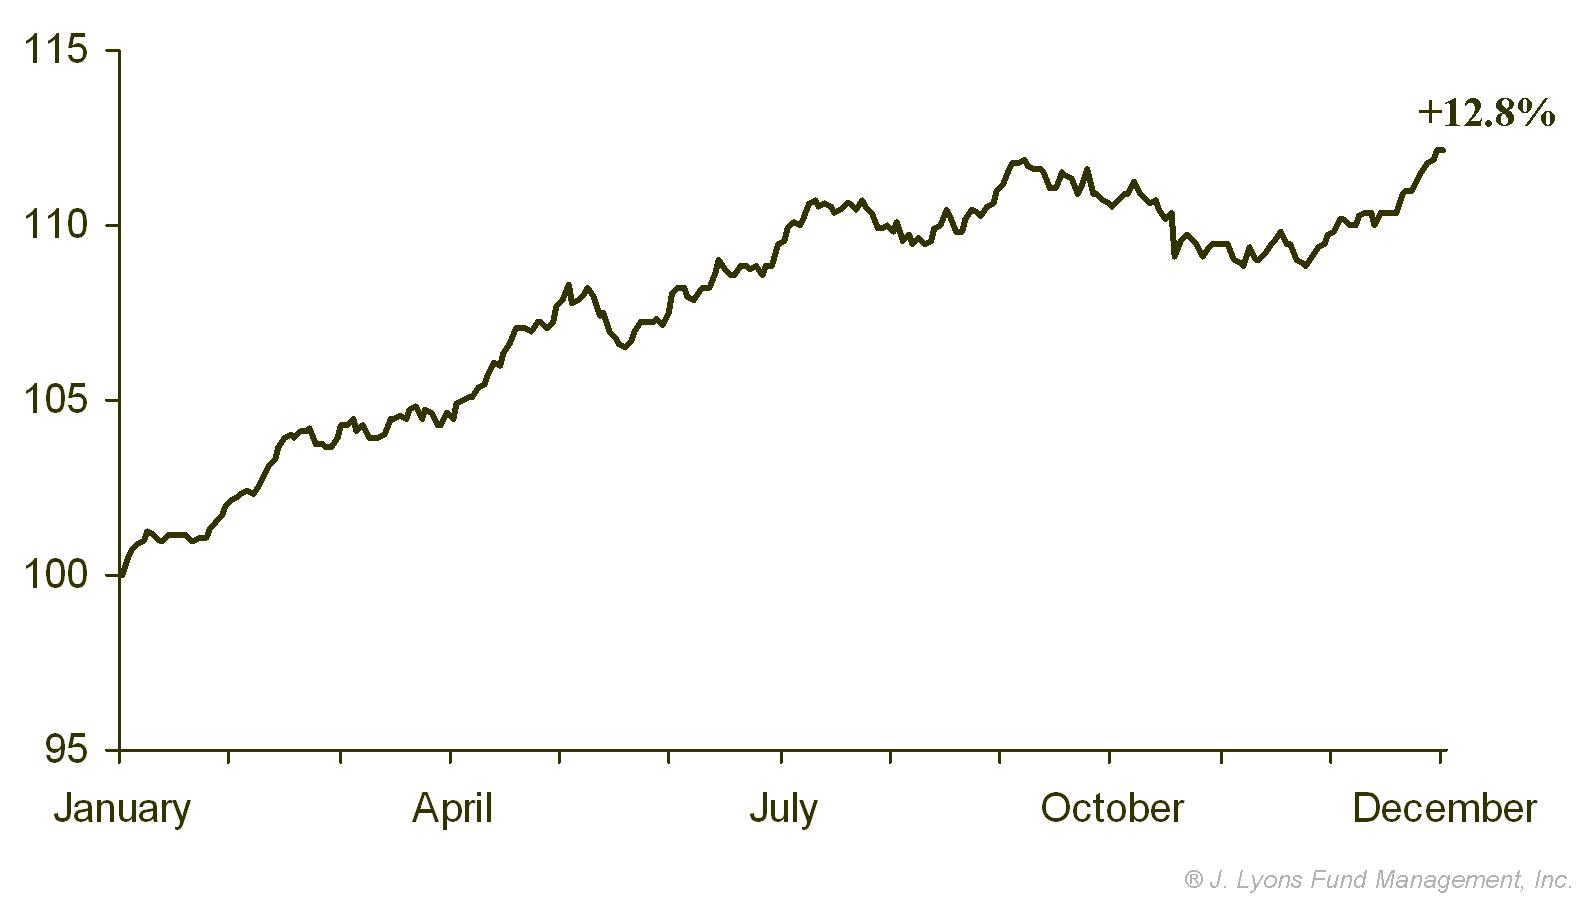
| Year 3 | 12.8% | 81% |
| Year 4 | 7.5% | 67% |
As you can see, the 3rd year of the Presidential cycle has historically been the best performing year in the stock market, as well as the most consistent. At 12.8%, its average return is more than 5% better than the next best year and 8 out of 10 times, the 3rd year exhibits positive performance. Many analysts attribute this out-performance to the tendency of a President to enact popular or market-friendly initiatives during the year leading up to an election. That makes sense, but we will leave the reasons to the talking heads. We are less concerned with the “why” than the “what”.
Secular Market Cycles and the Presidential Cycle
Continuing with our overarching thesis that the U.S. stock market is in a secular (long-term) bear market (which began in 2000 and will likely continue for the better part of this decade), we looked at 3rd year Presidential returns occurring in secular bear markets vs. those occurring in secular bull markets. If the pattern of strength was as consistent even during bear markets as it was on average, it would be strong evidence to at least temporarily reconsider the notion that the 2-year old cyclical bull rally was due to expire.
It turns out that there is indeed a significant difference in stock performance in the 3rd Presidential year depending on whether it occurs during a secular bull or bear market.
Presidential Cycle 3rd Year Returns by Secular Market Cycle
| Average Return | % of Years Positive | |
| During Secular Bull Markets | 23.7% | 92% |
| During Secular Bear Markets | 2.6% | 71% |
During Secular Bull & Secular Bear Markets
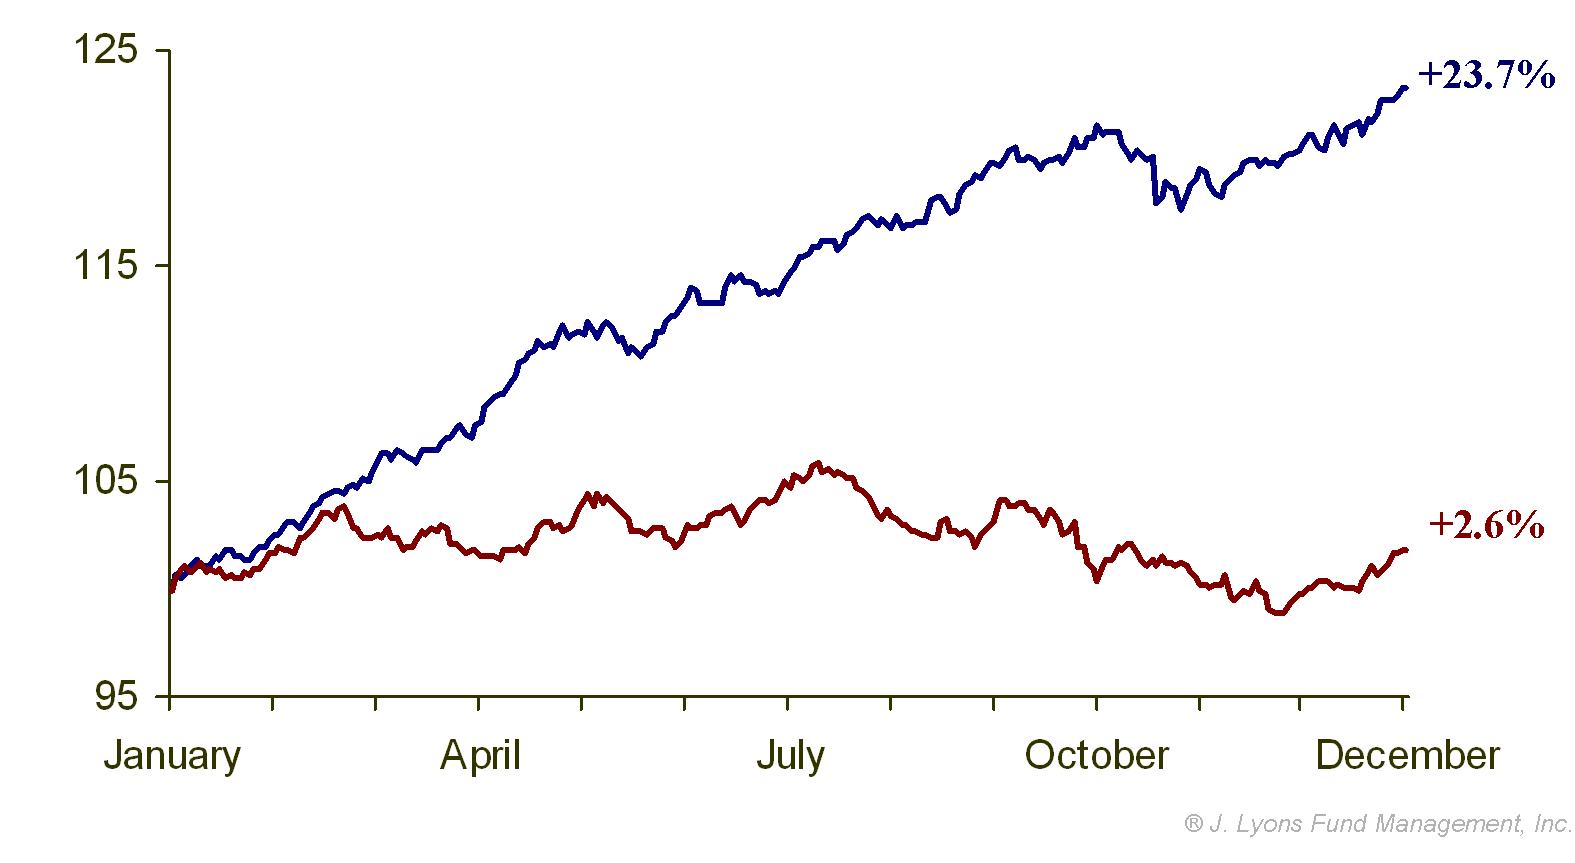
The average return for a 3rd year while in a secular bull was an impressive 23.7% with 12 of the 13 years being positive. Meanwhile the average 3rd year while in a secular bear was just 2.6%. A difference of > 20 percentage points is certainly statistically significant by any measure. 10 of the 14 3rd years were still positive, however, when in a secular bear market so it isn’t exactly a compelling reason to bail out of the market either.
Presidential
Cycle Returns by Quarter
The Presidential cycle pattern can be broken down further into quarterly returns and some suggest that the bulk of gains during this positive period actually occur during the 4th quarter of year 2 through the 1st
quarter of year 3. There is some truth to that notion as those two quarters are the second and third best quarters of the entire cycle.
However, the 2nd quarter of year 3 is the fourth best quarter and the final two quarters of the year are at least positive, on average. So the fact that the 1st quarter of this Presidential year 3 is ending is not by itself a sell signal for stocks.
Presidential Cycle Returns by Quarter
| Average Return | |
| Year 4 Quarter 3 | 5.1% |
| Year 3 Quarter 1 | 4.7% |
| Year 2 Quarter 4 | 4.6% |
| Year 3 Quarter 2 | 4.4% |
| Year 1 Quarter 2 | 4.3% |
| Year 4 Quarter 4 | 2.7% |
| Year 3 Quarter 4 | 1.4% |
| Year 1 Quarter 4 | 1.1% |
| Year 3 Quarter 3 | 1.0% |
| Year 4 Quarter 1 | 0.9% |
| Year 2 Quarter 1 | 0.7% |
| Year 1 Quarter 3 | 0.4% |
| Year 2 Quarter 2 | -0.4% |
| Year 1 Quarter 1 | -0.6% |
| Year 2 Quarter 3 | -0.8% |
| Year 4 Quarter 2 | -1.1% |
The Ides of April
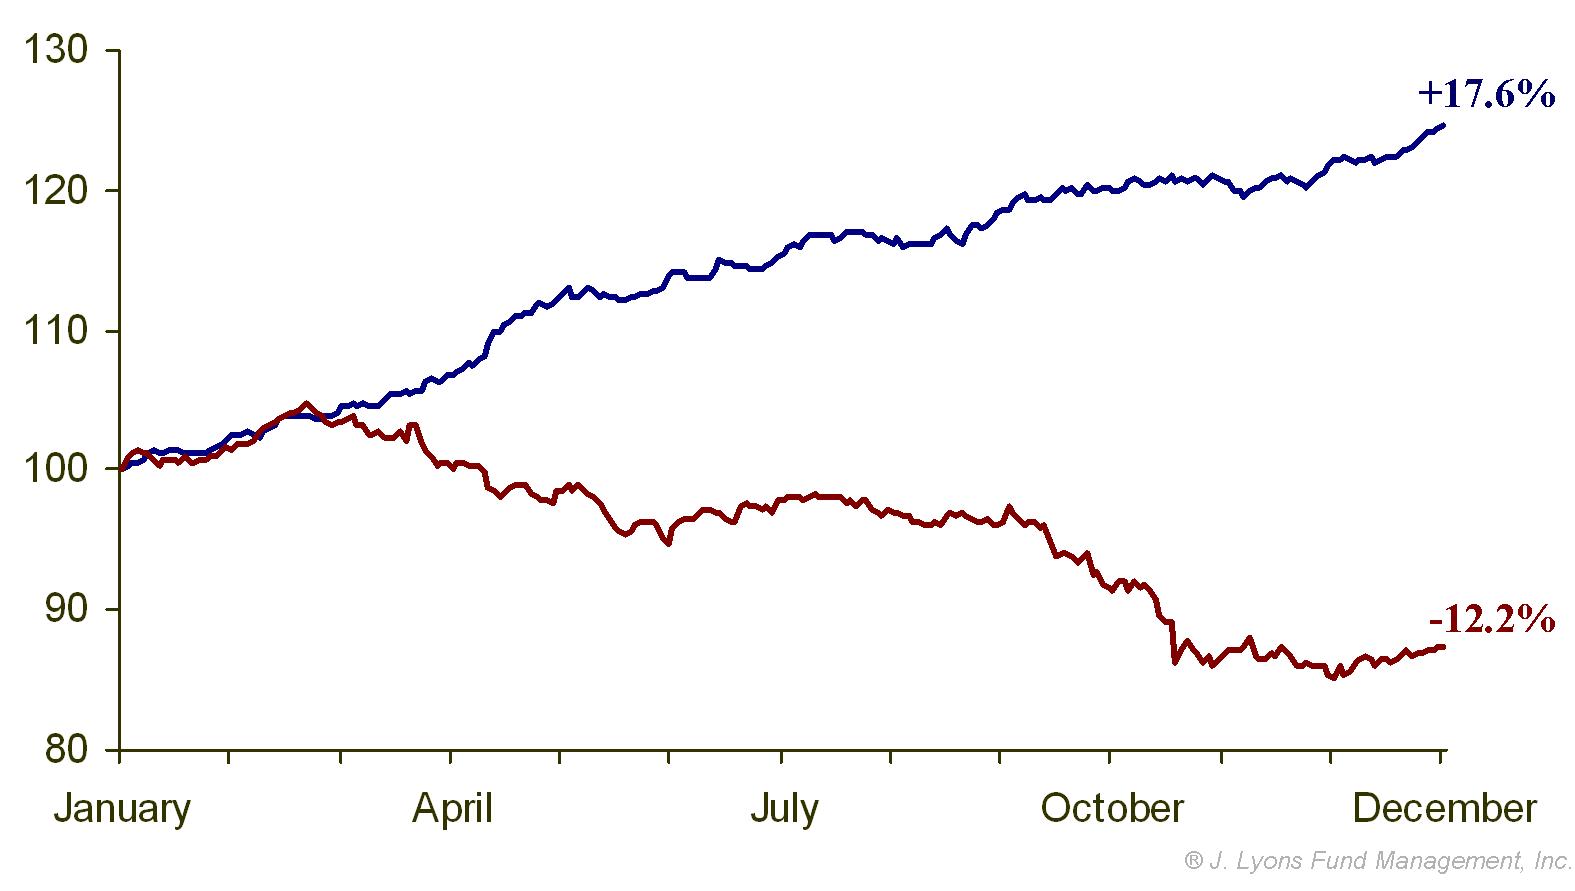
When studying the quarterly returns however, we did notice something significant in the data. On average, the first quarter of all year 3’s showed consistently strong returns. What transpired immediately after the first quarter, however, said a lot about how the market would perform the rest of the year. The year 3’s that performed the poorest tended to peak in the 1st quarter of the year. However, when the stock market made a new high in April (i.e., above the high of the 1st quarter), the market tended to perform better the rest of the year…much better.
When the stock market made a new high in April of a Presidential cycle 3rd year, the average return for the final three quarters of the year was an impressive 17.6%. When April failed to record a new high above the first quarter high, the market averaged a loss of -12.2% for the final 3 quarters of the year.
Based on New High in April/No New High in April
(Returns are from the end of the 1st Qtr to the end of the year)
Not only was there a substantial difference in the average returns for the remainder of the year, there was remarkable consistency in the market’s behavior based on the existence or non-existence of a new high in April.
Pres. Cycle 3rd Year Returns based on April High/No High
| Average
Return End of 1st Qtr to End of Year |
# of Years Positive |
|
| New High in April | 17.6% | 16 of 18 |
| No New High in April | -12.2% | 2 of 9 |
Of the 18 year 3’s in the Presidential cycle that made a higher high in April, 16 of them closed the year higher than where they stood at the end of the first quarter. And the two years that closed lower at the end of the year, 1943 and 1971, were down just 1% and 2% respectively (1943 did rally 7% above its first quarter high before fading.)
Of the 9 years that failed to make a higher high in April, just 2 of them closed the year higher than where they stood at the end of the first quarter, and only 1 of those years by more than 2%. 4 of the 9 years never made a higher high the rest of the year and only one of the 9 years was ever able to rally more than 2% above its first quarter high. That was 1987 which rallied 13% above its March high into August before the market crashed some 35% in October.
Conclusion
We might be accused by some of data mining, that is breaking down the data until we find a trend or pattern that fits our forecast. The flaw in that thinking is that we do not have, nor do we make, forecasts. We are students of market history and we believe that certain patterns do tend to repeat throughout time, due primarily to the fact that human nature never changes. If there is a pattern, cycle or market tendency, whether bullish or bearish, that can help guide our investing then we are more than happy to take it into consideration.
The majority of market participants believe there is validity and reason behind the historical tendencies of the Presidential cycle. We believe the evidence we’ve displayed in this issue is even more significant and compelling than the overall Presidential cycle statistics. If that is the case, then our findings should be received with at least as much acceptance. Though, this study is not intended as an investment strategy by itself. This is simply a data set based on over 100 years of market history that should be used as one of many inputs in making investment decisions.
The practical takeaway is obvious. If the market is able to make a high in April above the February highs (and not immediately collapse), then historical evidence suggests that the rest of the year will likely provide positive investment returns. Conversely, if the market fails to make higher high in April, the investing environment for the rest of the year should be more difficult. The highs formed by the markets in late February have established a solid “line in the sand”. Those highs are obvious resistance and if new highs are made, it will be a meaningful signal of strength, even apart from the research above. Some of the stock averages are already knocking on the door of their previous highs so we may get an answer sooner than later.
Dana Lyons
Vice President