| December 2010 |
The Crash of 2008 - What Now?
Using History as an Appropriate Guide
“Mankind is so plagued by provincial thinking pertaining to time. We always think 'At last, our generation has things figured out once and for all'. To a great extent it is this prideful reliance on our earthly accomplishments which gives the assurance that the ups and downs of economic cycles will continue.”
To be sure, in the realm of financial market analysis a study of history can produce helpful guidance in gaining an objective look at the current situation being confronted. This, of course, is true not only of the study of financial markets but also of life’s lessons in general. Without question, the axiom is true about repeating the mistakes of the past if we do not make ourselves aware of them.
However, another problem also exists at the other end of the spectrum. Here we are referring to a misuse, as well as an overuse, of such historical comparisons that seem especially commonplace in regard to financial markets. Without straying too far from the specific intent of this paper, in our experience the misuse and overuse of comparisons of present market conditions with those that seem to have had some degree of similarity is usually flawed for one specific reason. Specifically, the periods being compared are not like parts of similar cycles.
The reason why we often dismiss such conclusions directly relates to one omnipresent constant: human nature. People react differently based not only on current conditions (e.g., a market decline) but also on what remains in their memory banks from prior times, and which suggests what is normal to them. An example might be that the reaction to a sharp market decline in the midst of a bear market, one part of a cycle, will elicit a different response than one that occurs in a bull market, another part of a cycle. In addition, even if the reaction appears similar, conclusions about similar future activity may well be flawed.
The studies that we have done and which appear below do compare the current situation with historically similar periods. Moreover, we are led to examine periods for comparison that appear to have occurred at similar times in previous cycles of prosperity, specifically at the end of such “good times”. Our goal in this analysis is to determine what forthcoming financial market scenario seems most likely. If valid, as we feel the conclusions are, one should be forewarned that the character of the foreseeable future of the stock market will be quite different than what we have come to expect. Moreover, it would indicate that the popular questions being ubiquitously asked about when the bottom will occur are the wrong questions at this time.
Secular Bear Markets
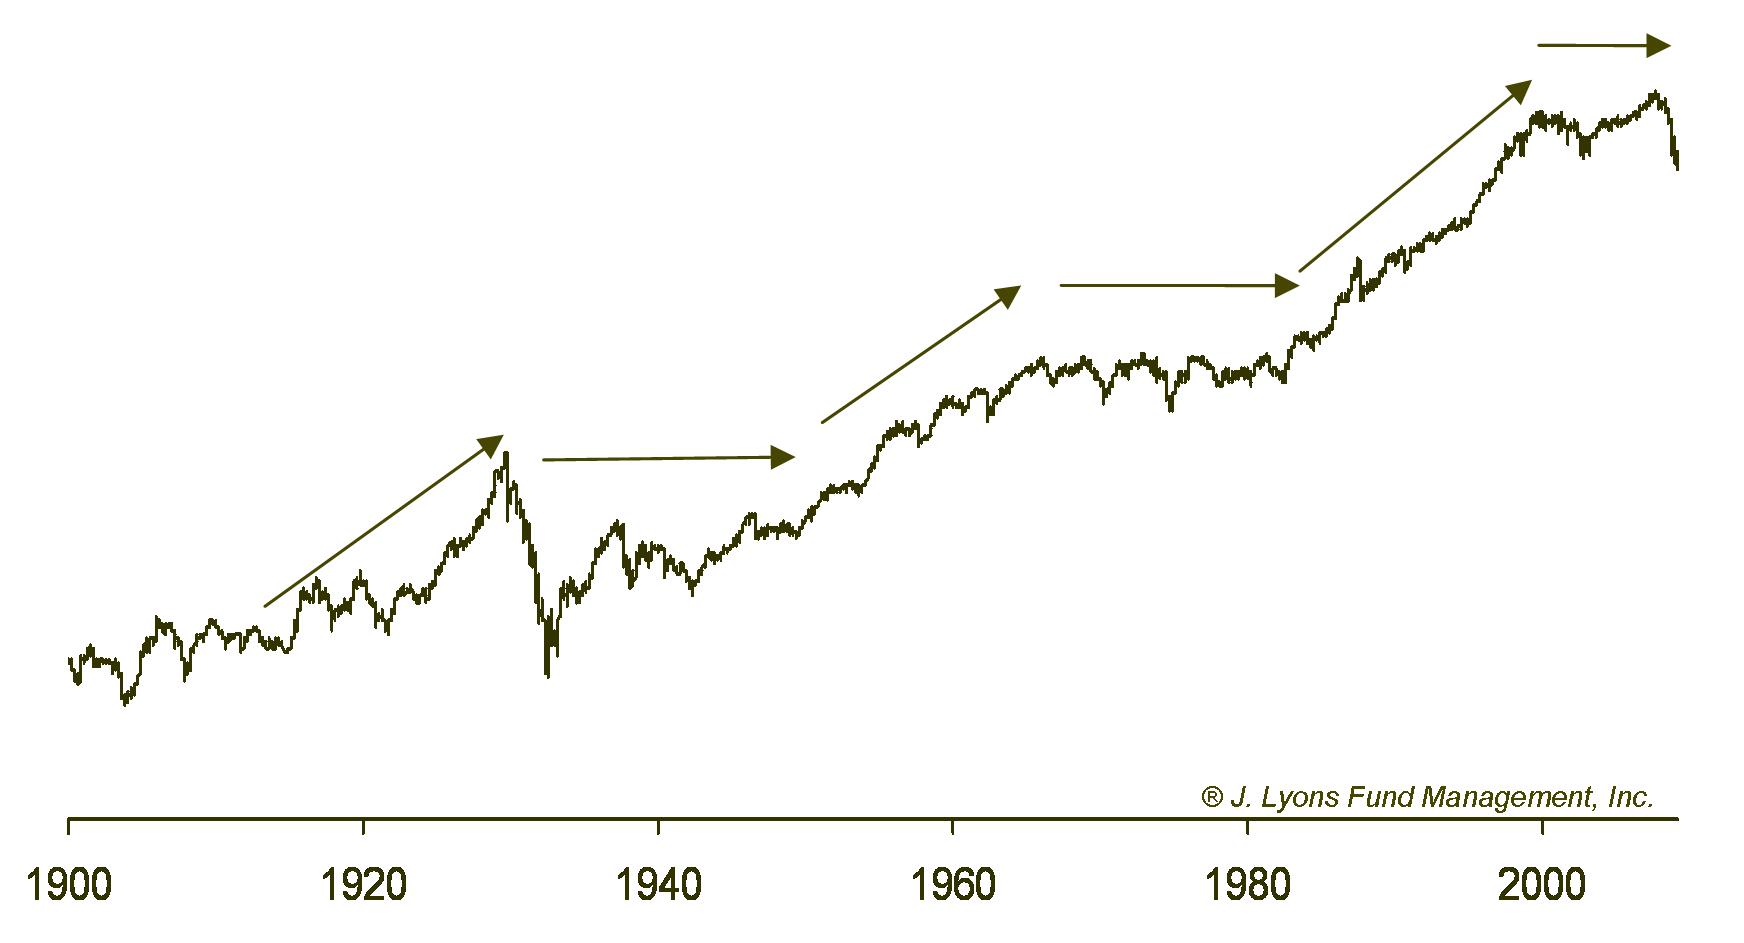
As we have warned now for several years, what we termed a cycle of affluence peaked with the bursting of the Nasdaq bubble in early 2000. Life was extended somewhat to the cycle by the low interest rate environment made possible in part by the appetite for our treasuries by China in particular. This, plus government sponsorship of the marketing of sub prime loans kept the credit bubble from deflating until 2007. Now it is apparent that the roughly 18-year stock market cycle of alternating secular (long-term) bear and bull markets is right on schedule. The chart below shows that the last bull cycle lasted from 1982 to 2000. Therefore, we are likely roughly halfway through the current secular bear cycle that began in 2000. It can also be seen that this cycle has persisted for over 100 years with impressive repetition.
In
an attempt to ascertain what future course this market might
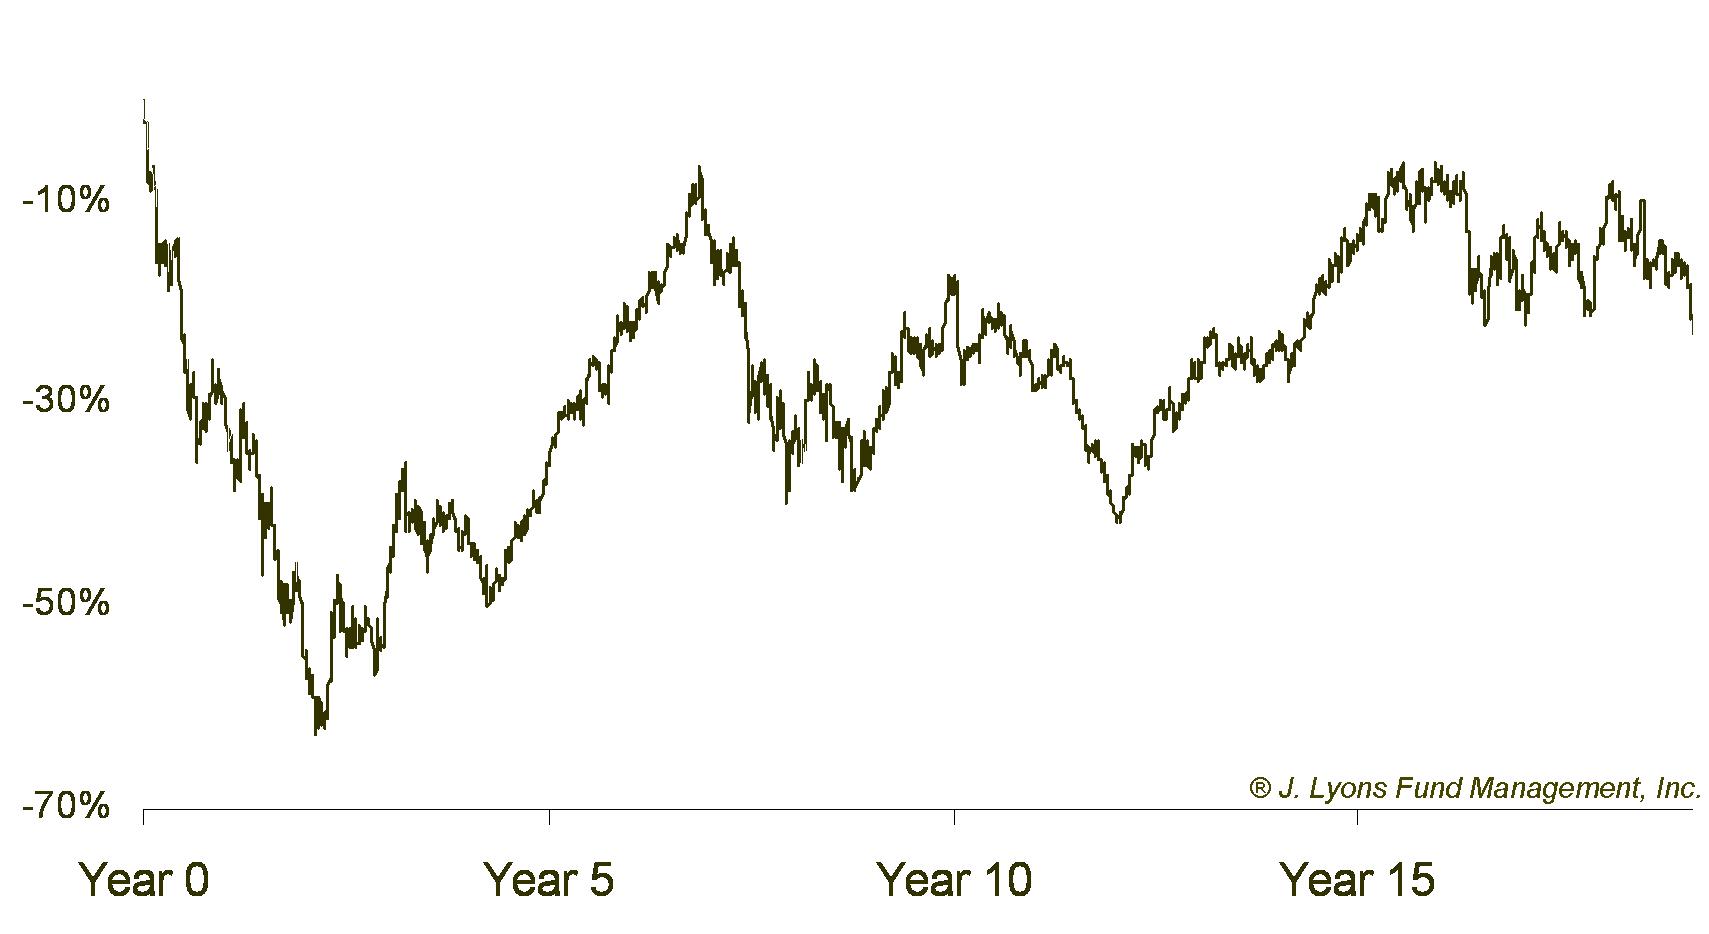
have for the remaining 8–10 years of this cycle we have constructed
what might be a typical secular bear market by averaging the price
movement of the Dow Jones Industrial Average during the last
two such secular bear markets. Specifically, we are talking about the
bear market from 1929 to 1949 and the one from 1966 to 1982. The
result of that averaging is what we've termed the Secular Bear Market
Composite in the chart below.
As
can be seen, the roughly 18-year period is characterized by swings up
and down resulting in a market
that ultimately goes nowhere. Now that we are 9 years into that bear
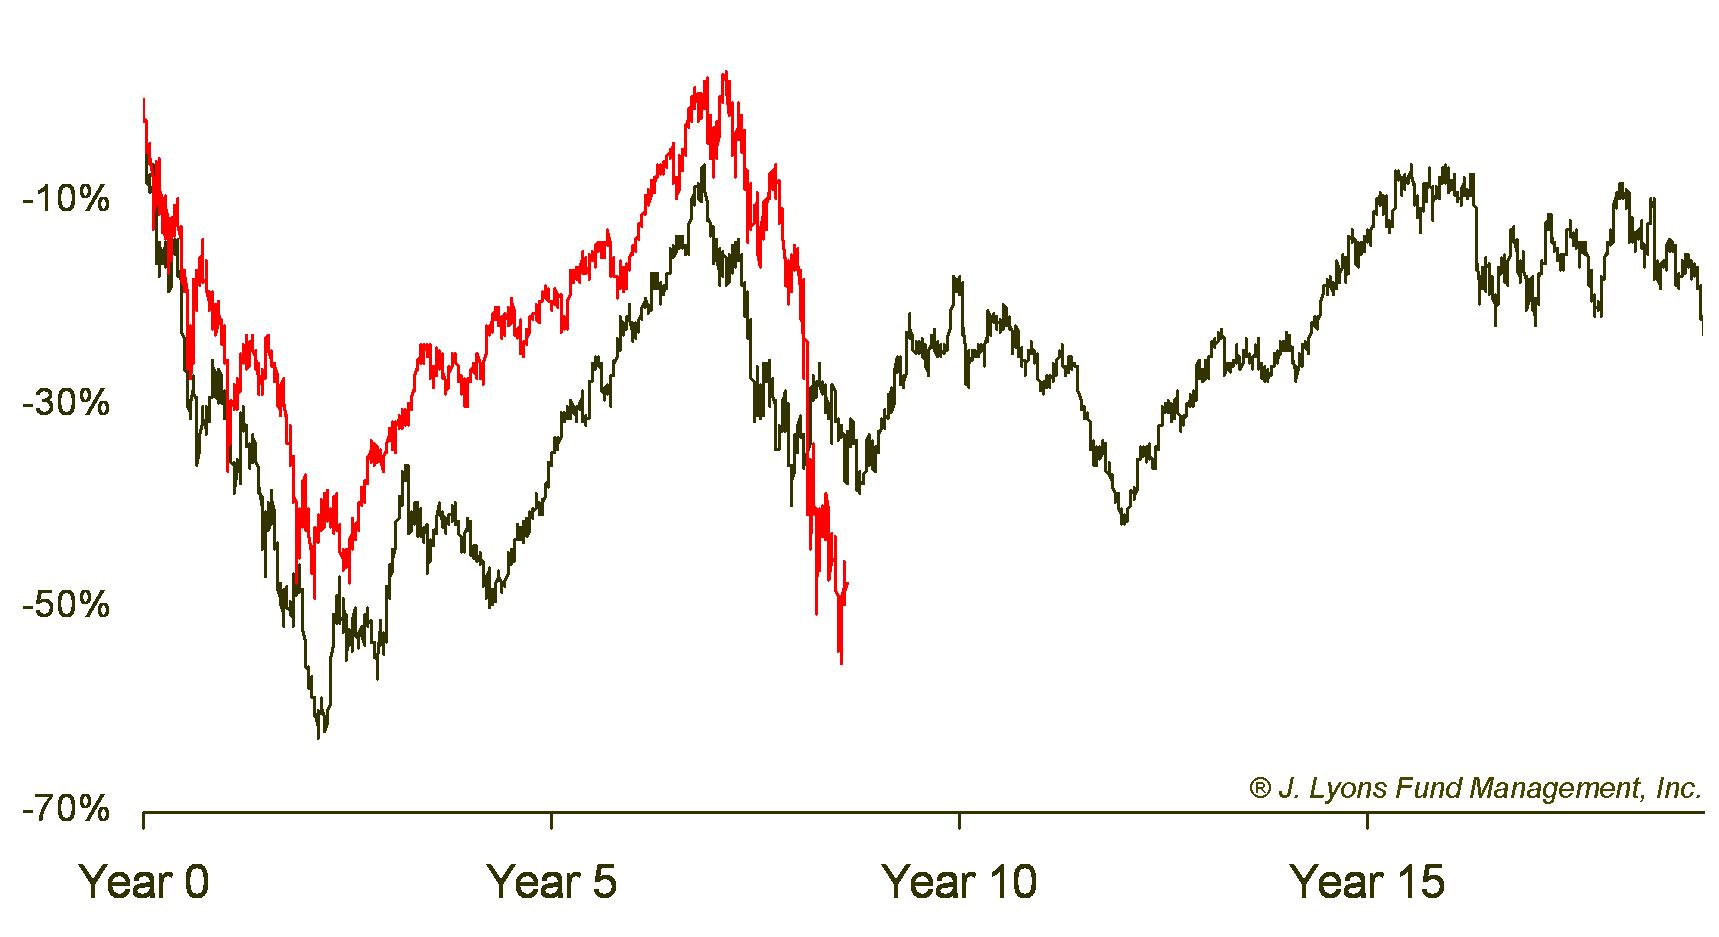
phase, let’s look at how the current market as measured by the
S&P 500 has behaved in the years since the inception of this
secular
bear market in 2000.
The
similarity between the price behavior of the current market with that
of previous secular bear markets is striking. Now, we do not expect the
market to continue to so closely trace the price plot of the composite
over the latter half of this secular bear market. Indeed, the further
we move away from the inception of the bear, the more variation we will
likely see. However, the point to be heeded here is that, in general,
we can expect the stock market to generate very little in the way of
returns over the next 8-10 years.
Post-Bubble Markets
The history of “bubbles” is an interesting one and tracks man’s inevitable journey from fear to greed and back again. Our study of bubbles indicates that much can be learned although it is most difficult to profit from such knowledge. We say that because most everybody - governments, companies and investors alike - will be caught up in the emotions of a bubble while it is developing and will not be nimble enough to escape its unwinding. Nevertheless, there are observations, as in the study of secular markets above, that may help orient those who take the message to heart.
First of all, a bubble comprises a price journey of a product or market that starts ascending gradually, becomes parabolic in its ascent, subsequently declines as rapidly as it went up and ends at a point at or near where it started. Most bubbles take years to complete and, interestingly, the product or market involved typically also goes sideways at best for several years after the bubble bursts as the excesses continue to be worked off.
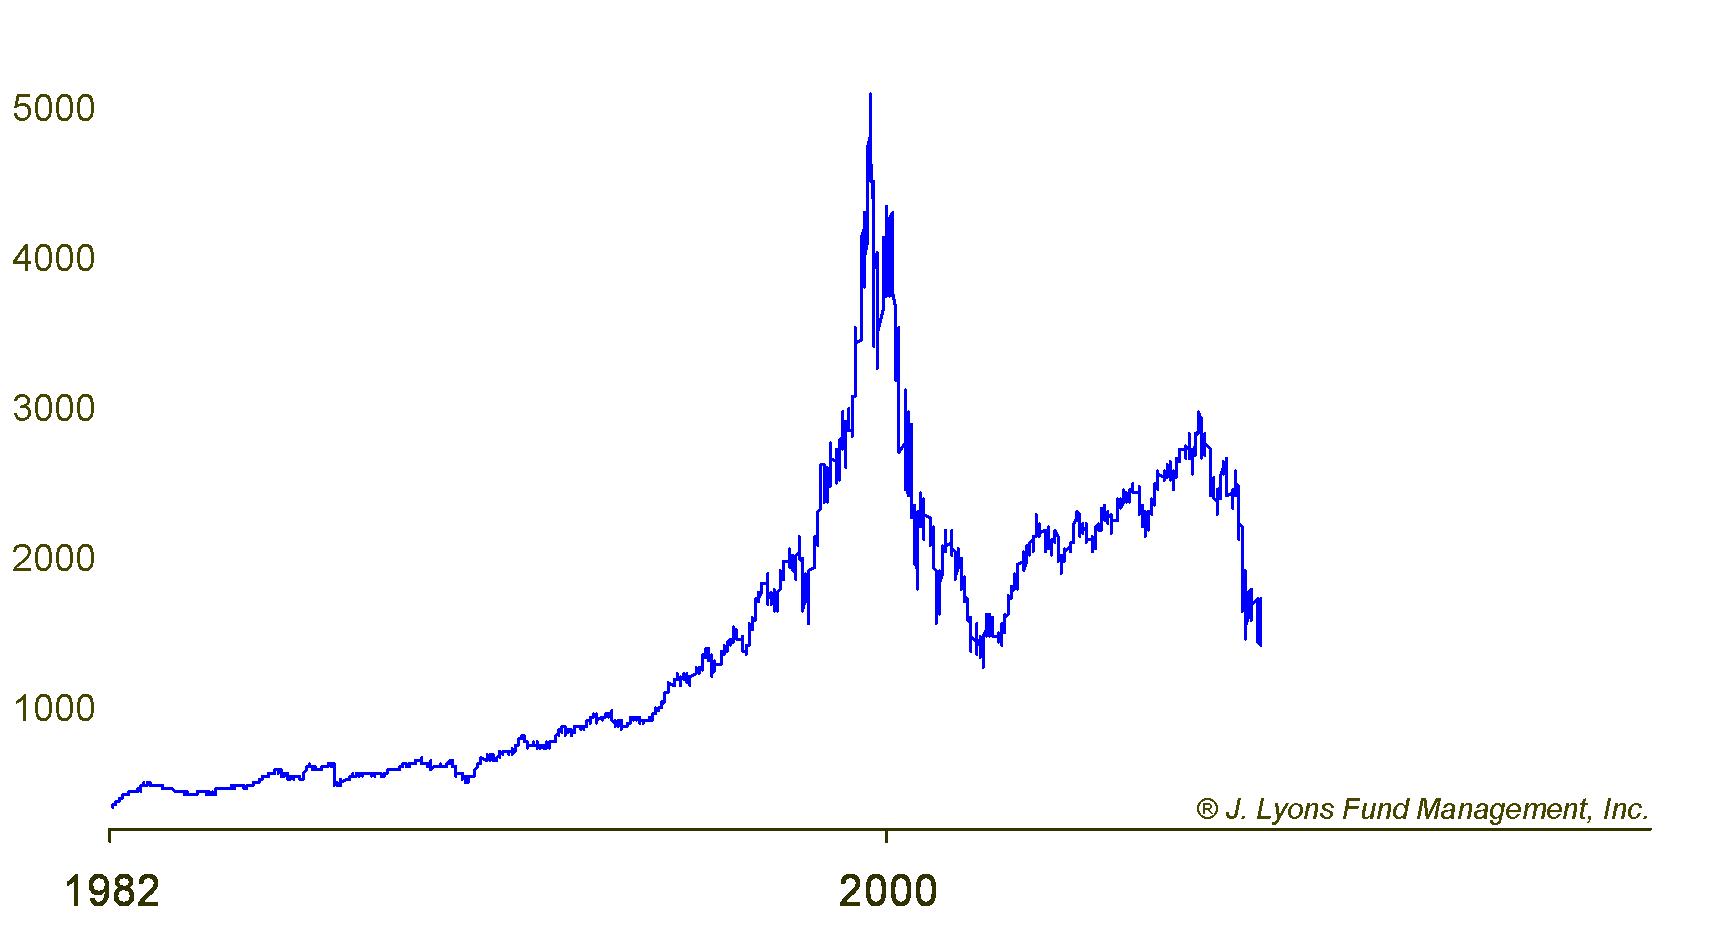
As might be suspected, bubbles often but not always occur in clusters. The reason for this is the environment of greed that develops during the time such bubbles are building. So far, early in this new century we have already witnessed several bubbles beginning with the technology bubble, as reflected in the Nasdaq Composite, which burst in 2000. Subsequently, we've seen bubbles in the China stock market as well as in other emerging country stocks, oil and other basic materials and, of course, in world wide real estate prices.
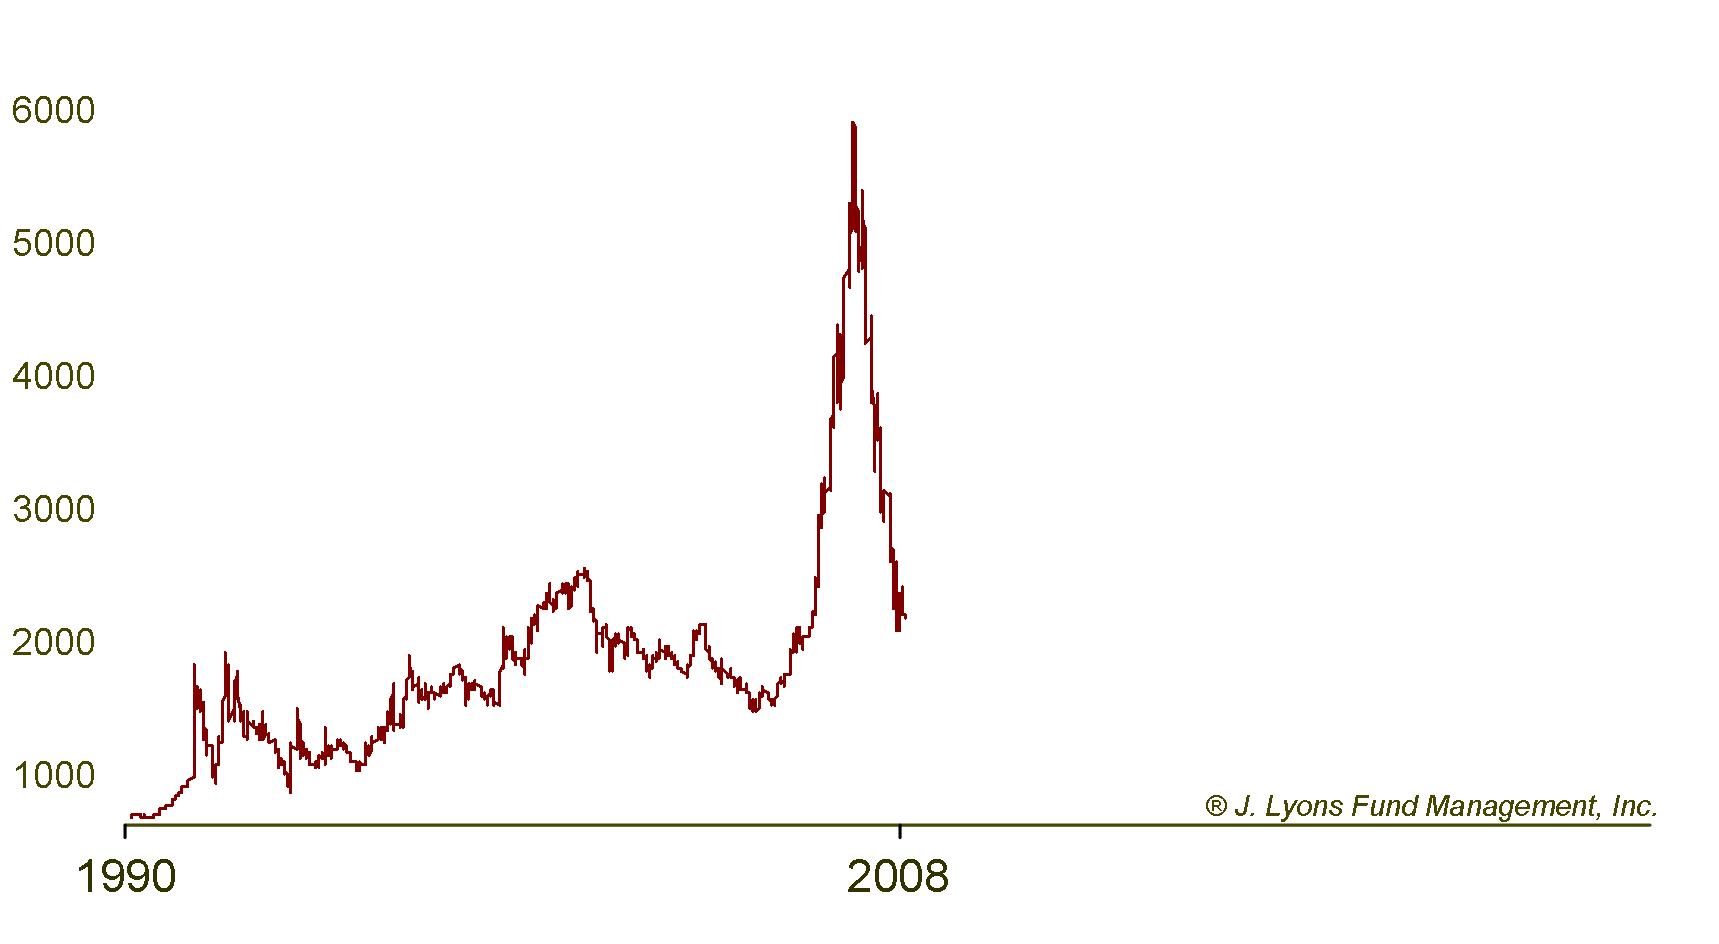
Post-Bubble
Implications
As stated above, little if any net progress is normally made in the aftermath of bubbles for a period of many years, although often that course is characterized by wide swings. To get a possible idea of what might well be the path of future markets, particularly the U.S. stock market, we have constructed a typical post-bubble composite by averaging two substantial bubbles of the past, the Dow Jones Industrial Average which peaked in 1929 and the Japanese Nikkei Average. (Our selection of these bubbles was purely arbitrary. We would expect similar results from the combination of other bubbles as most of them look roughly the same.) That Bubble Composite chart is shown below.
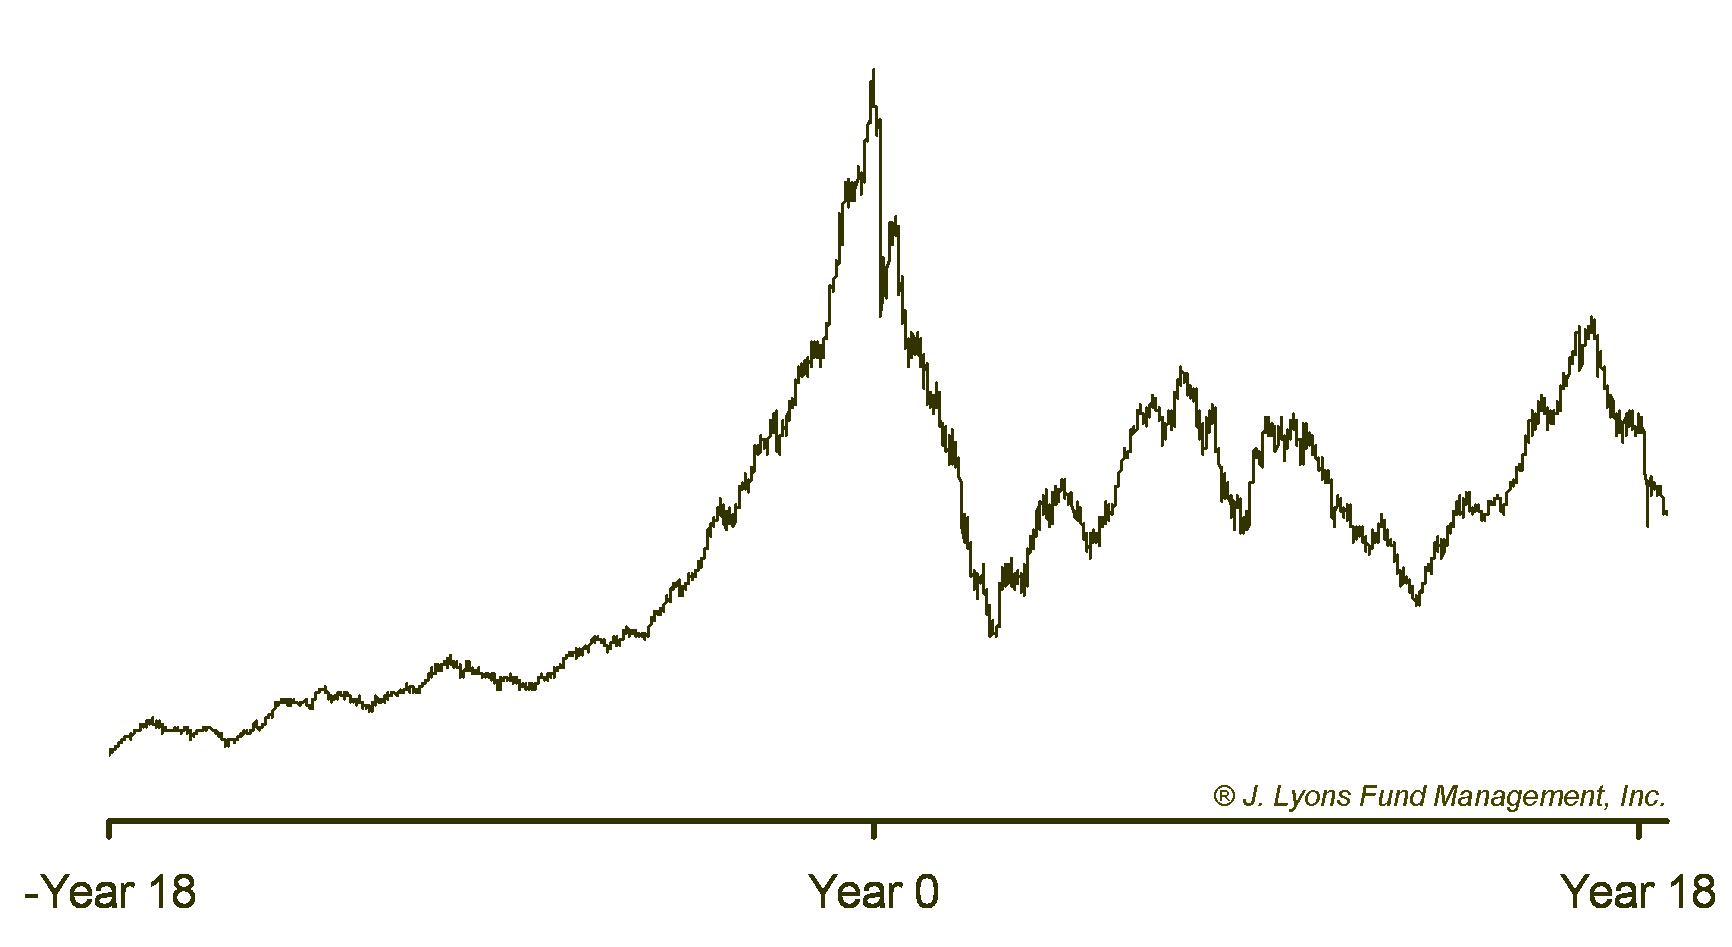
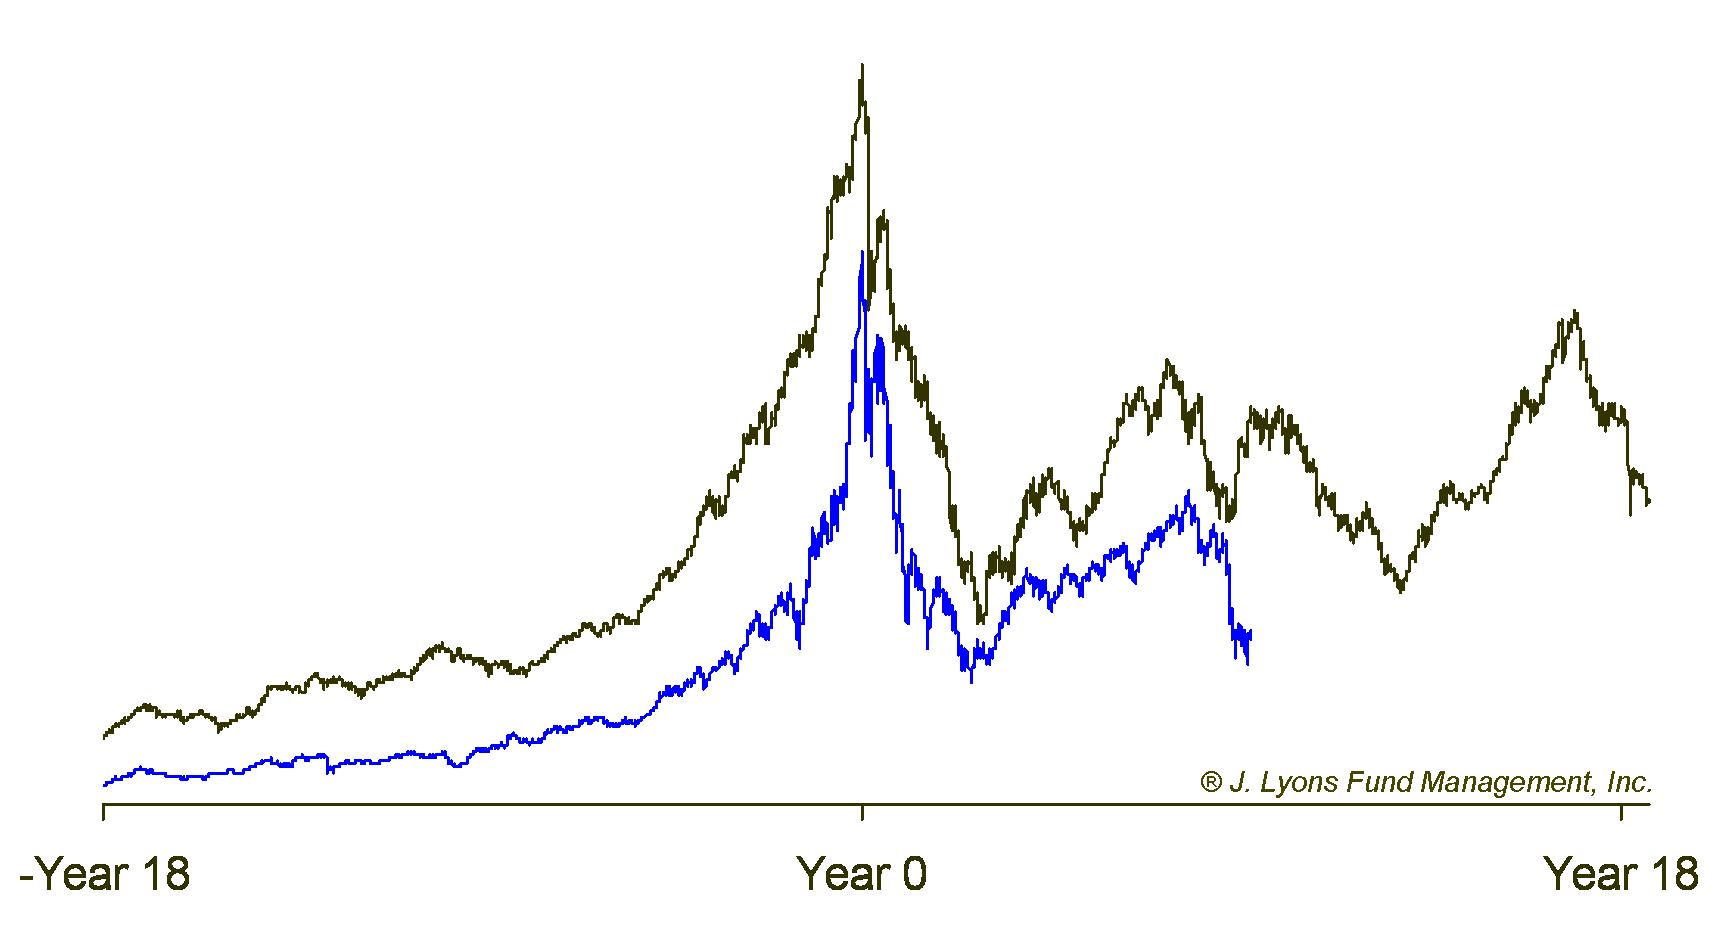
As with the secular bear market chart earlier, let’s now look to see how the market since the Nasdaq bubble burst has tracked the typical post-bubble market. (The Nasdaq and Bubble Composite plots are on different scales; however, it is the similarity in the price pattern, not the amount of the move that is noteworthy.)
Conclusions
The studies above which examine the secular cycle of the U.S. stock market as well as the character of secular bear markets and post-bubble markets would indicate that we have probably 8 to 10 years before we are out from under the effects of both the secular cyclicality and the post-bubble shadow. It is notable to us that both these studies conclude that during these years many of the markets mentioned, most notably the U.S. stock market may well experience little to no progress at all. (Considering other factors, “no progress” may be overly optimistic but here we will stick only to the evidence derived from the studies mentioned above.)
Many will argue that because there are so many differences involved between today’s situation and historic events, between government policies then and now and between the character of markets in general that it is wrong to assume that the patterns of the past will persist today. Our observations of past markets as well as of investor behavior suggest that that is not the case. In fact, a case could be made that one of the most predictable phenomenon in markets is the response to them by investors. I will add that that is especially true at important junctures of change.
Evidence of that can be seen in the rather amazing tracing out of the pattern of each of the synthesized Secular Bear Market Composite and the Bubble Composite by both the S&P 500 and the Nasdaq. As most of this study was done a few years ago, it has been rather impressive to observe how closely that tracking has continued. At this point, it is difficult to conclude that the cause of the patterns which can be repeatedly observed in past markets and which have now been so closely traced out once again over the first half of this secular bear cycle could simply be assigned to chance. In addition, in our minds there is quite a compelling case for that similarity in tracking to continue for the rest of the approximate 18-year cycle.
Additionally, it might be reasonably concluded that the odds supporting fears of oil going back to the $150 barrel level or hopes of real estate recovering significantly are unlikely to be realized any time soon. We believe psychologists will tell you that, in many cases, such projections are probably aided and abetted by the memory of what people recall and therefore what they feel is “normal”. However, the argument that there is “just so much oil in the ground” is no more valid in projecting prices than the argument we used to hear to defend an inexorable rise in prices of real estate, namely that “God only made so much land”. Markets fluctuate and moreover will always overshoot reality on both the high and the low side.
One last point. Having said that we can expect little or no net progress over the next several years, we are not saying that there will be no opportunities for investors. On the contrary, markets will probably experience a number of substantial rallies of several months duration. However, for followers of the increasingly discredited buy-and-hold investing, it will be a discouraging time because these rallies will end badly if lessons of history continue to prevail.
Specifically, the stock market has great odds of resembling that of the 1970’s or the 1930’s or even the Nikkei market since the early 1990’s. There will definitely be opportunities but conventional Wall Street establishment guidance will not aid investors in exploiting them any more than it aided investors in avoiding disaster in 2008. A secular bear market will require different investment strategies. Unfortunately, the ones still in the memory banks of investors and the ones that have served the bottom line of the Wall Street establishment so well will simply produce increasing disillusionment just as it did during all other secular bear markets.
Eventually, when the ranks of
investors in the stock market has
dwindled to a very low number as it did in 1982 and when Wall Street
tells you to nail down profits before they disappear, you will know
that the secular bear market has ended.
John S. Lyons
President