J. Lyons Fund Management, Inc. Newsletter
| January 2012 |
Posted January 1, 2012 |
| Tweet |
 |
Running to Stand Still
2012 Secular Bear Market Update
"The only value of stock
forecasts is to make fortune tellers look good.”
- Warren Buffett
A new year is upon us once again and in the investment business that can only mean one thing: stock market forecasts. From Wall Street pundits to business TV personalities to industry journals, the end of the year brings about a deluge of predictions about where the stock market is going to be a year from now. While they may make for convenient talking points in the lazy, sound-bite oriented world in which we now live, we agree whole-heartedly with Mr. Buffett. These forecasts are worthless. That is, unless investors ill-advisedly base their investment strategy for the next 12 months on these predictions, in which case they are worse than worthless -- they are harmful. As Mr. Buffett goes on to say, "short-term market forecasts are poison and should be kept locked up in a safe place, away from children and also from grown-ups who behave in the market like children."
2011 once again illustrated the ineptitude of market prognostications. The consensus of forecasts a year ago was that stocks would be strong, especially emerging markets, commodities would by and large be up and that bond yields would rise sharply in 2011. Unsurprisingly, stocks are mostly down this year, especially emerging markets, commodities are by and large lower and yields are sharply lower.
Even dismissing the fact that the consensus of such forecasts is almost always woefully inaccurate, relying on a 12-month forecast to construct one's portfolio now is lazy and short-sighted. What if the conditions that are assumed in constructing the forecast turn out to be wrong? What if some exogenous event occurs which disrupts the entire order of the financial markets? Flexibility of strategy and adaptability to changing markets must be characteristics of one's investment plan if success is to be possible.
Investing would be easy if it was possible to accurately and consistently predict where markets would be trading 12 months from now. Of course most investors would agree that that is an absurd notion and wouldn't knowingly attempt such a strategy. However, that is precisely how most people invest and precisely what most of the investment establishment advises. The only difference is that they are forecasting the next thirty years!
Most investors select (or are recommended) a portfolio consisting of stocks or funds that they are told to hold for the "long-term", i.e., until retirement in, say, thirty years. What these investors, or their advisors, are doing in essence is making a forecast that these will be the best investments to hold for the next thirty years. If a 12-month forecast is absurd, how about a 30-year forecast? Given the dismal 12-month forecasting track record of so-called experts, it would be a shock of these stocks were the most attractive investments now. It is beyond imagination that these stocks will be the best investments over the next thirty years.
Yet, this is the "strategy" of the vast majority of investors in America because that is what the investment establishment has instructed them to do. For investors who fall into this category, and who are open-minded enough to consider the possibility that just maybe their current holdings will not necessarily be the ideal investments at all times over the next thirty years, we urge them to make a change. Find an advisor with an Active Management strategy that will be flexible enough to adapt to the market shifts that are certain to take place over the next thirty years.
For us, January means it is time for an update on the status of the on-going secular bear market. Distinct from a forecast, this is simply a recognition of the current market environment and its general implications for investors going forward. As in previous updates, we take our own unique look at similar historical periods in the market to instruct us regarding the present situation.
Secular Bear Market Update
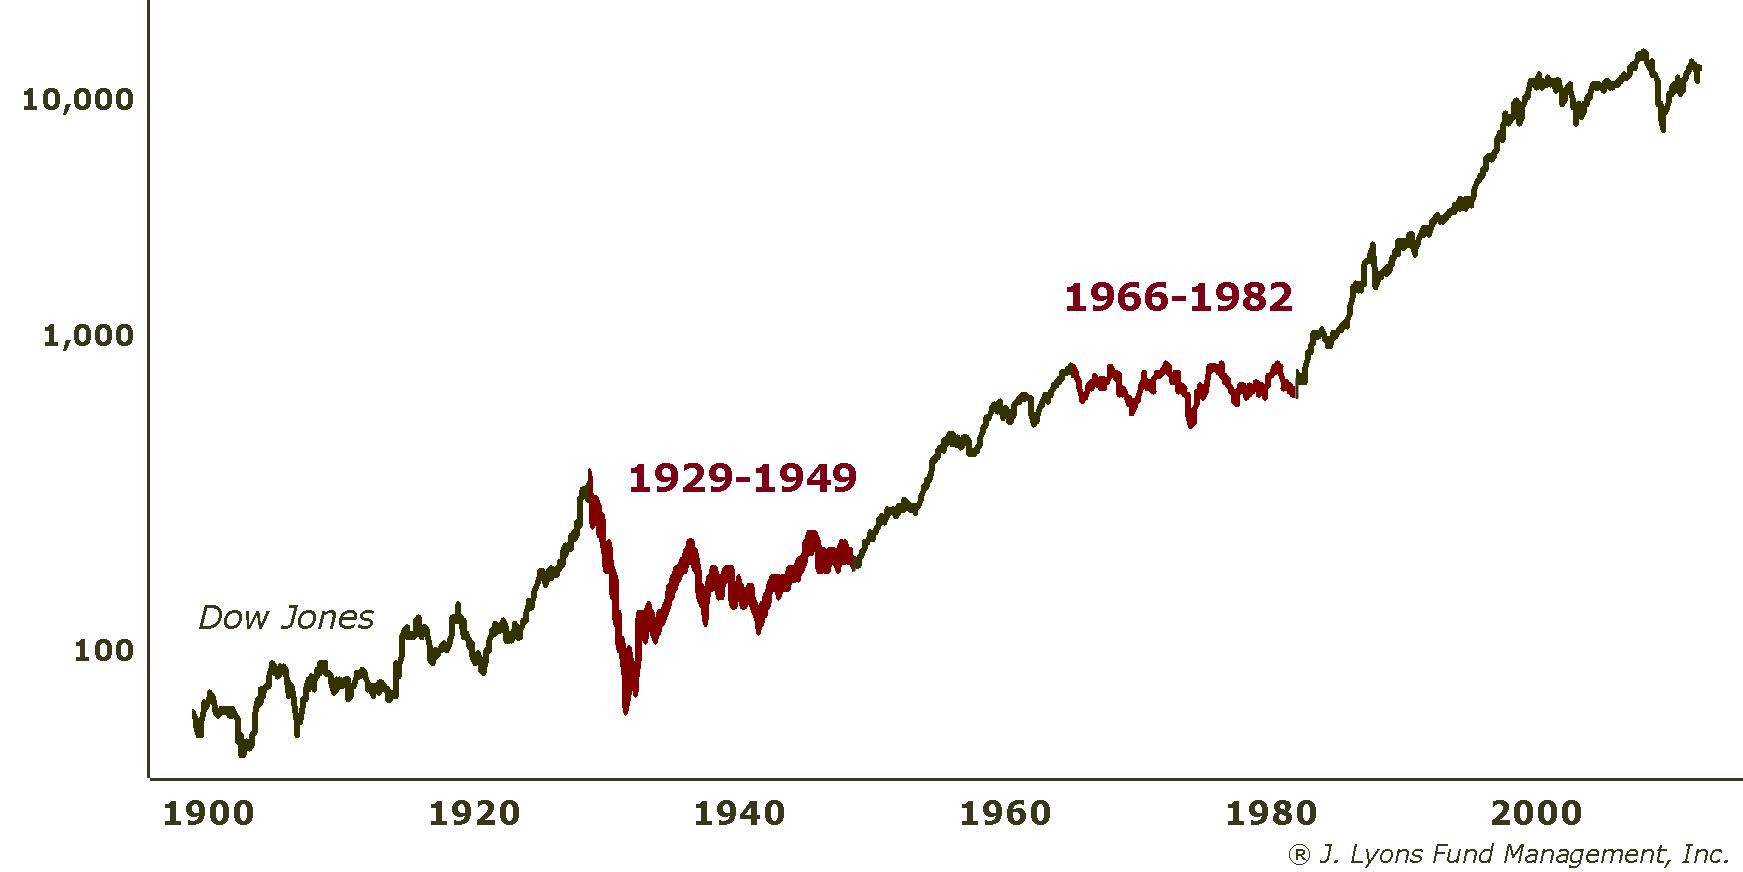
For years we have maintained the belief that the U.S. stock market is in the midst of a secular, or long-term, bear market. In such an environment, stocks experience significant alternating swings, up and down, but will generally move sideways for a period of roughly 16-20 years. In an update of this view a year ago, we argued that the past decade of sideways movement in the market has lent validity to our argument. 2011 certainly did nothing to refute that argument. The S&P 500 came out of the gate with a 100-point rally, subsequently fell 300 points, then gained back 200 points over the last three months. For those unable to follow that math, that leaves the market right where it started the year. All that running just to stand still.
A few years ago, we first introduced a “secular bear market composite”. Readers may recall that we constructed the composite by simply averaging the market performance (using the Dow Jones Industrial Average) during the previous two secular bear markets, specifically those from 1929-1949 and from 1966-1982. (We only use these two secular bear markets in computing our composite since they are the only ones in which we have reliable daily price data; however, this general market pattern has existed for centuries, both in the U.S. and abroad.)
Combining those two secular bear markets produces a "composite" that looks like the chart below. As mentioned, secular bear markets are quite volatile, with wide swings up and down. But in general, they move sideways over their duration of roughly 18 years.
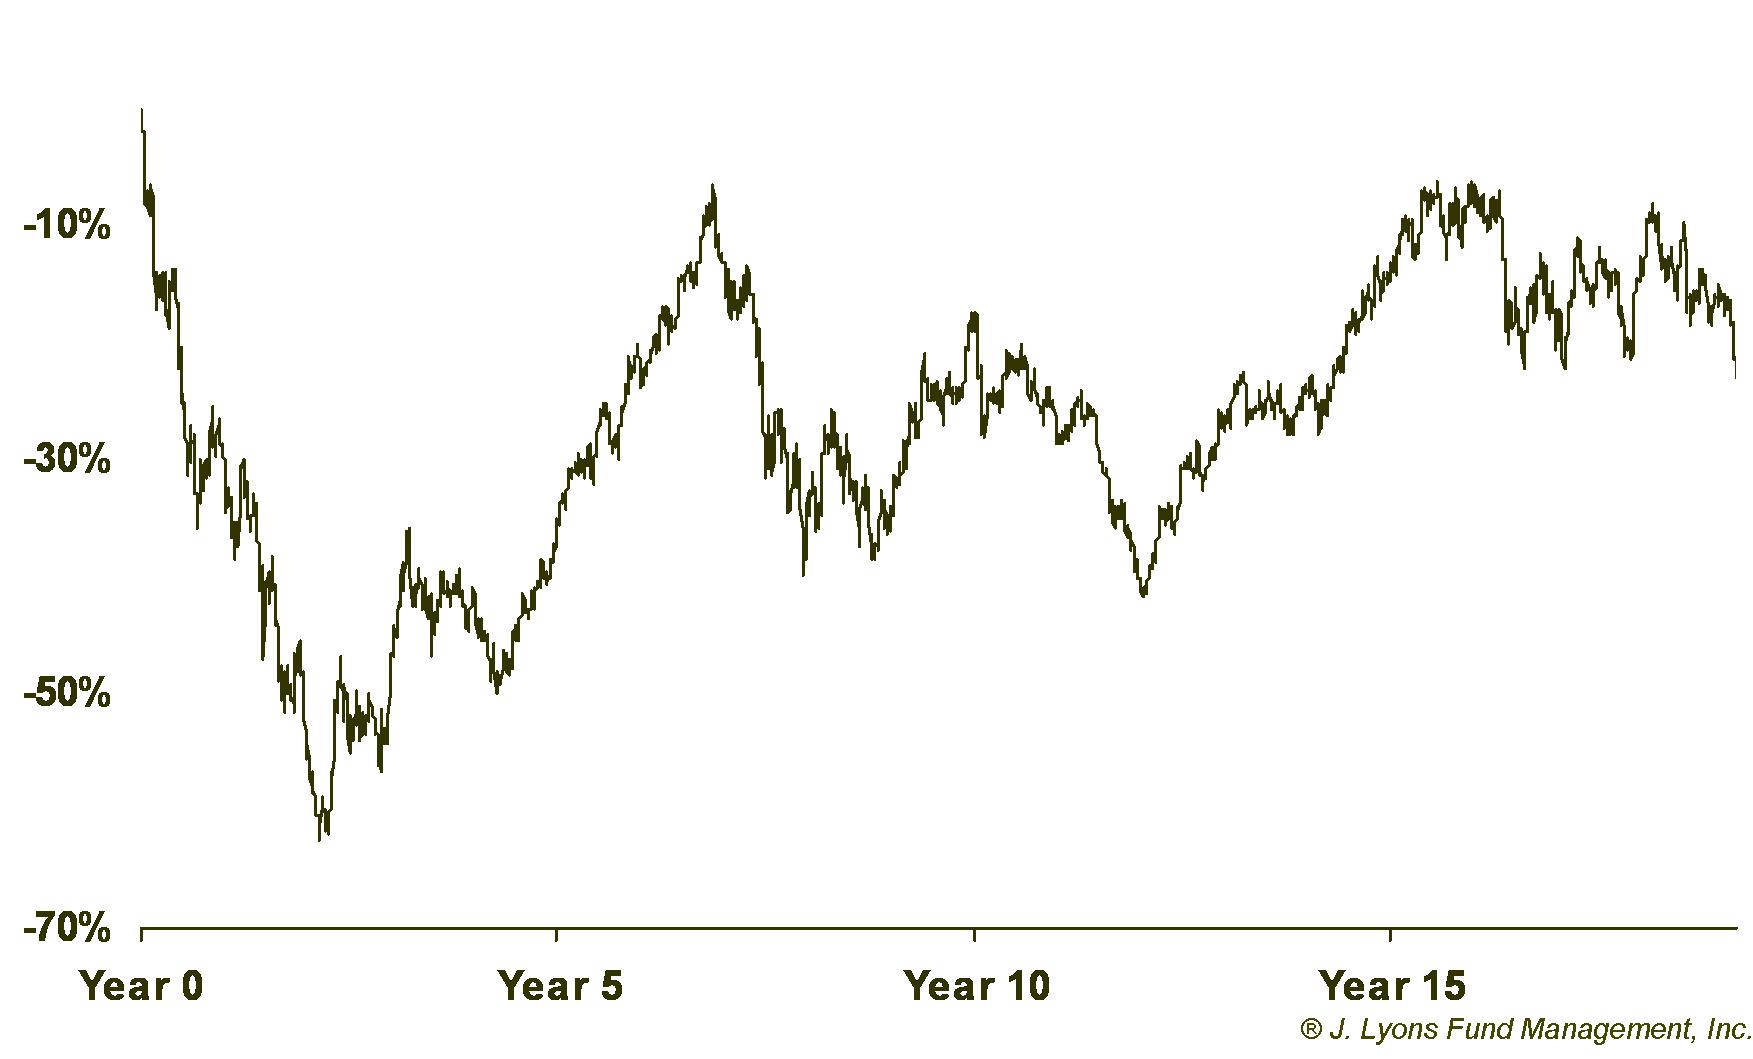
As we have stated in the past, the goal in generating the composite chart was to produce a visual of the general pattern of a secular bear market in order to provide investors with an idea of what they can expect during such a period. Plus, as long as the current market tracked the general pattern of the composite, it would be certainly back up our belief that we were indeed undergoing a secular bear market. And hopefully, this illustration might provide compelling enough evidence to convince some buy-and-hold investors of the difficult road that lies ahead if they continue with their same strategy.
Here is a chart of the composite with an overlay of the current S&P 500 (starting in 2000). The similarities remain evident.
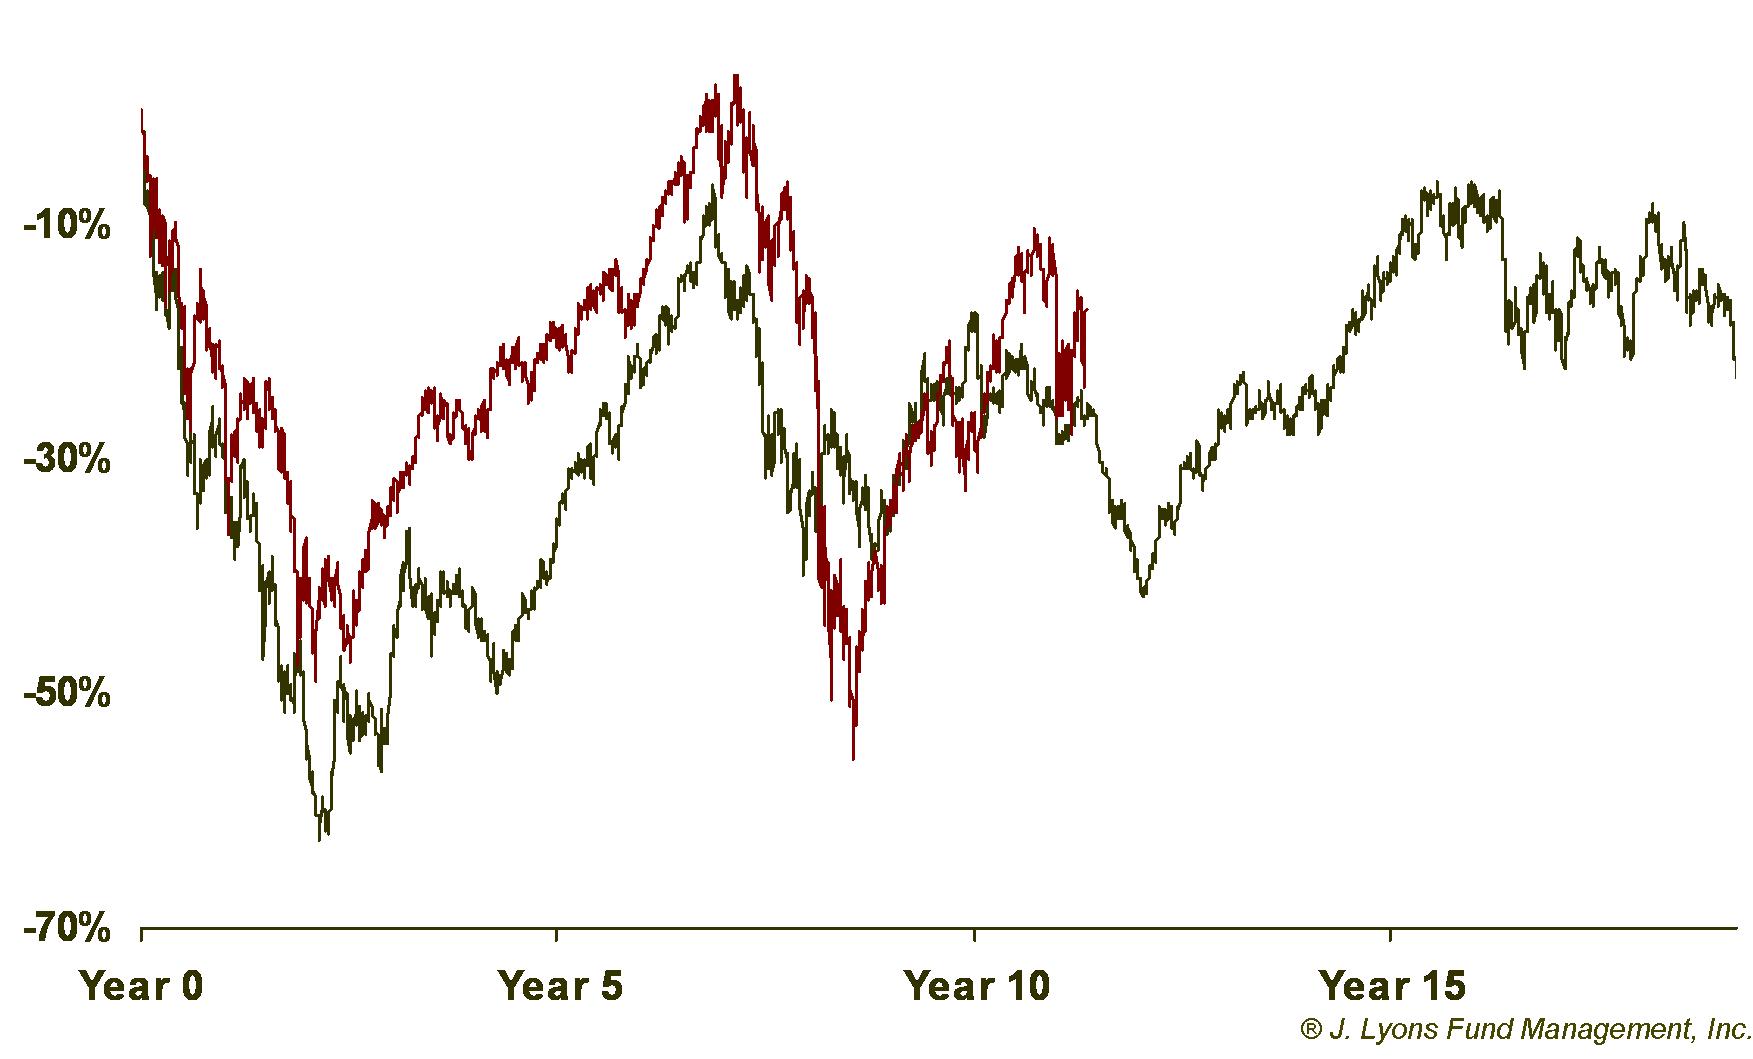
Post-2009 Cyclical Rally Likely Finished
A year ago, we discussed the fact that the post-March 2009 cyclical (shorter-term) rally that continued to unfold was likely running out of steam. That conclusion was suggested by the fact that the secular bear composite had also topped out at a corresponding point roughly a year ago. Additionally, since the post-2009 rally was the 2nd cyclical rally during this secular bear market, we compared it to the 2nd cyclical rallies that occurred in the prior two secular bears in the 1930s and 1970s.
After studying the action of those rallies, it was evident that, by historical standards, the post-2009 rally was getting a bit long in the tooth. Sure enough, after continuing for another four months to start the year, the market action over the remainder of the year strongly suggests that the rally is done. The 2009-2011 rally, while not identical, was certainly similar to the historical rallies of the 30s and 70s (As Mark Twain said, "history doesn't repeat itself but it does rhyme.") While we are loath to assign fundamental reasons to market action, recent quantitative easing may be responsible for the outperformance of the recent rally vs. its historical comparisons.
Gain |
Duration |
%
of Previous Decline Recovered |
|
| Average
Rally (from 1930s and 1970s) |
66% | 18 months | 72% |
| Recent
Rally (March 2009-May 2011) |
105% | 26 months | 78% |
The rally was particularly similar in terms of the percentage of the previous decline (from 2007 to 2009) that it recovered. Perhaps the most important takeaway here for investors is the fact that, even after a rally of over 100% in two years, the market still remains considerably below its 2007 peak. That is the essence of a secular bear market. There will be significant rallies along the way; however, they will likely only bring buy-and-hold investors' portfolios back to break-even, at best. Only through a strategy incorporating some type of Active Management can an investor hope to accumulate gains during a secular bear. Investors need some type of mechanism to avoid incurring substantial losses during cyclical bear markets, such as 2000-02 and 2007-09. Otherwise, subsequent rallies like the recent 105% move will only be about temporarily recovering previous losses.
What Now?
With the cyclical rally likely over, nearer-term prospects for U.S. stocks are obviously not as bright. While we do not believe the market will necessarily continue to track the secular bear market composite precisely, it has tracked all of the major moves for the past twelve years. Therefore, we believe that such major moves in the composite should still be respected as a guide for our current situation. A glance at the bear composite chart reveals that history suggests the next major move is lower.
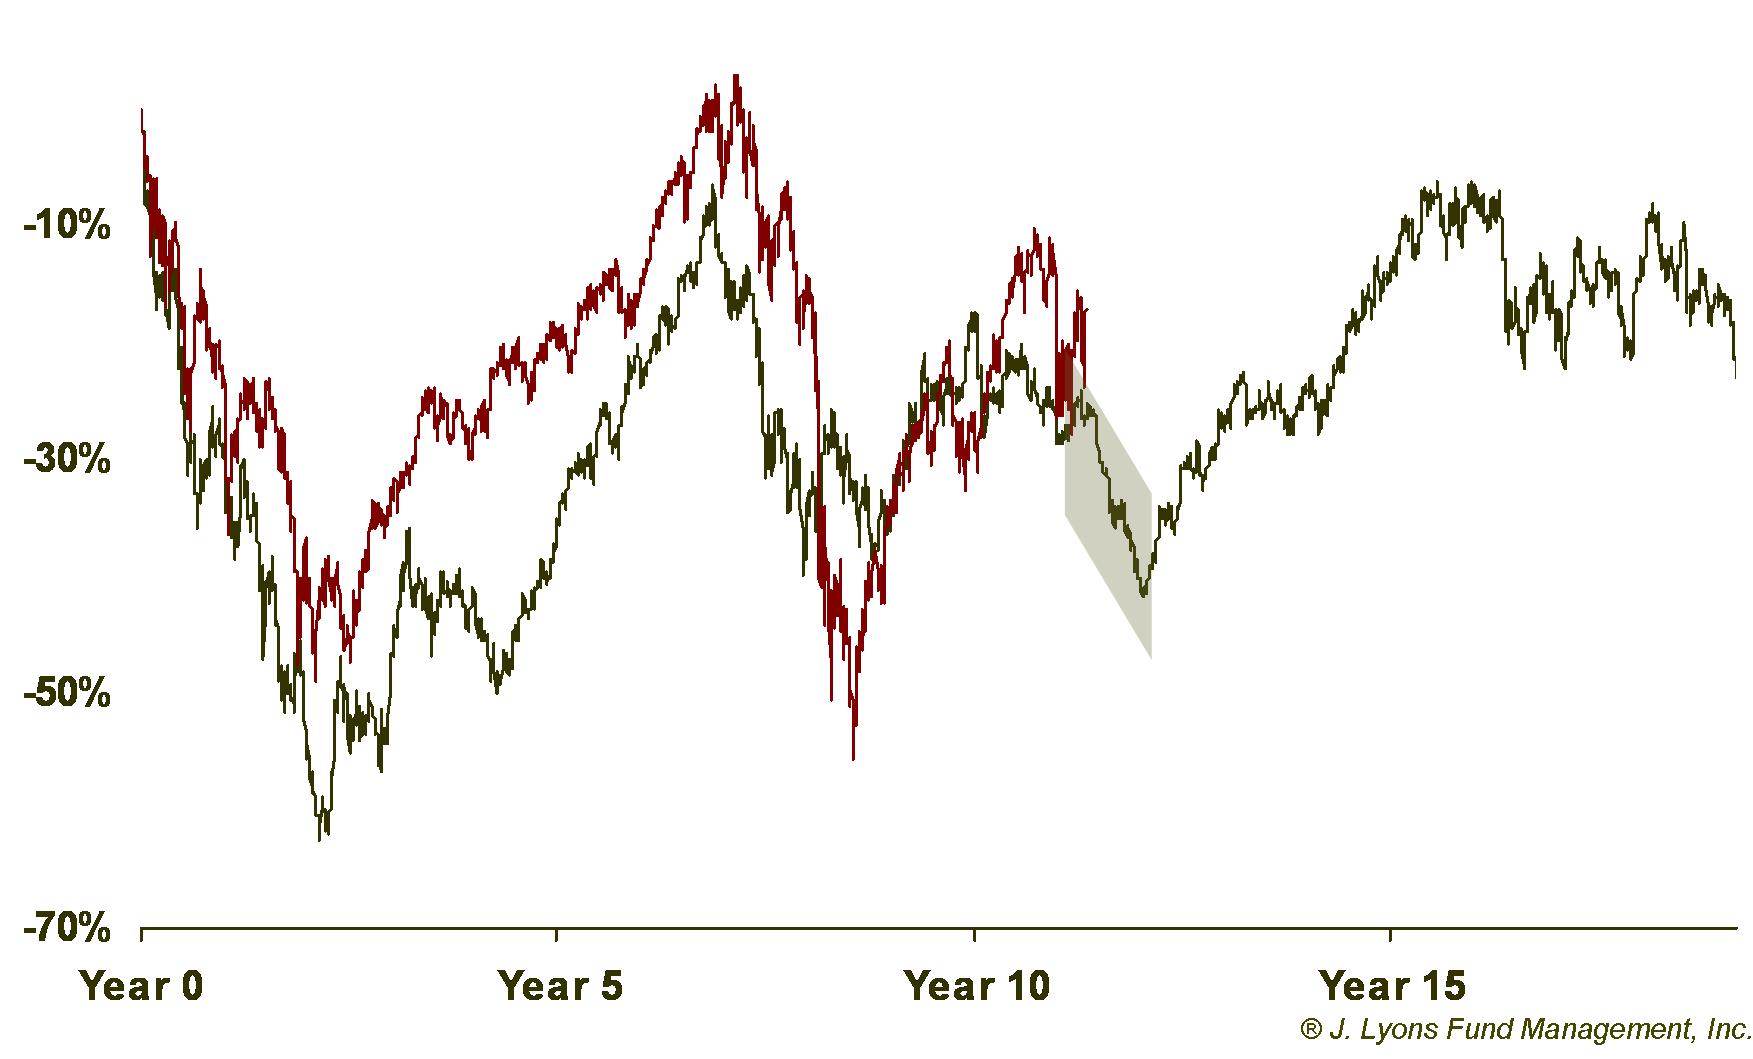
The composite, timing-wise, is due for a decline of 20-plus percent over the next 10 months or so. That doesn't mean the current market will experience the same scenario, either in the magnitude of decline or in the timing. However, we expect that the cyclical rally is over and that the next major move, when it comes, should be lower. For what it's worth, a decline of more than 20% from current levels would bring the S&P 500 near the 1000 mark.
To emphasize again, it is not our forecast that the current market must continue to track the composite so closely, nor is this study something that dictates our specific investment decisions. Additionally, as the current secular bear market moves further away from its beginning in 2000, we expect the closeness in tracking to diminish. However, we find the persisting similarities so compelling that we feel the composite likely will continue to be instructive regarding the general path of the current market.
A year ago, we also examined the market action of the prior bear markets after the 2nd cyclical rallies had ended. On average, after the rallies ended in 1939 and 1976, stocks suffered a 25% loss at some point over the next few years. It then took an average of five years before the rally highs were broken. And even after surpassing the rally highs, stocks remained in the general area of those highs three years after that. Therefore, on average, it took eight years from when the second cyclical rally ended before the stock market began to make sustainable gains for investors.
Applying these figures to the current market would put the S&P 500 at around 1028 sometime in the next few years (using the recent high of 1370.) And if the market follows the historical pattern, we won’t see new highs until 2016 and we won’t begin a new secular bull market until 2019.
| Post-Rally Loss |
Time until Rally High is Broken |
Time until Rally High is Permanently Broken | |
| Average
2nd Cyclical Rally (from 1930s and 1970s) |
-25% | 5 years | 8 years |
| Projections
for Current S&P 500 (Based on Averages) |
1028
Low |
2016 | 2019 |
The Good(?) News
If history is to be a reliable guide, the good news is that the March 2009 low was likely the low for this secular bear market. The previous secular bear markets had made their low during either the first or second cyclical declines. The secular bear that began with the crash of 1929 made its low at the end of the first cyclical decline in 1932. The 1966-82 secular bear market made its low during the second cyclical decline in 1974.
Of course, even if that is the case, it doesn't mean that the market will resume a sustainable upward advance. Nor does it even mean the market will advance at all above its previous highs, or even from here. Even if the 2009 low in the S&P 500 of 666 holds, it still allows for a near-50% move from current levels before we would reach that support low. However, history suggests the market will find support before it reaches that level.
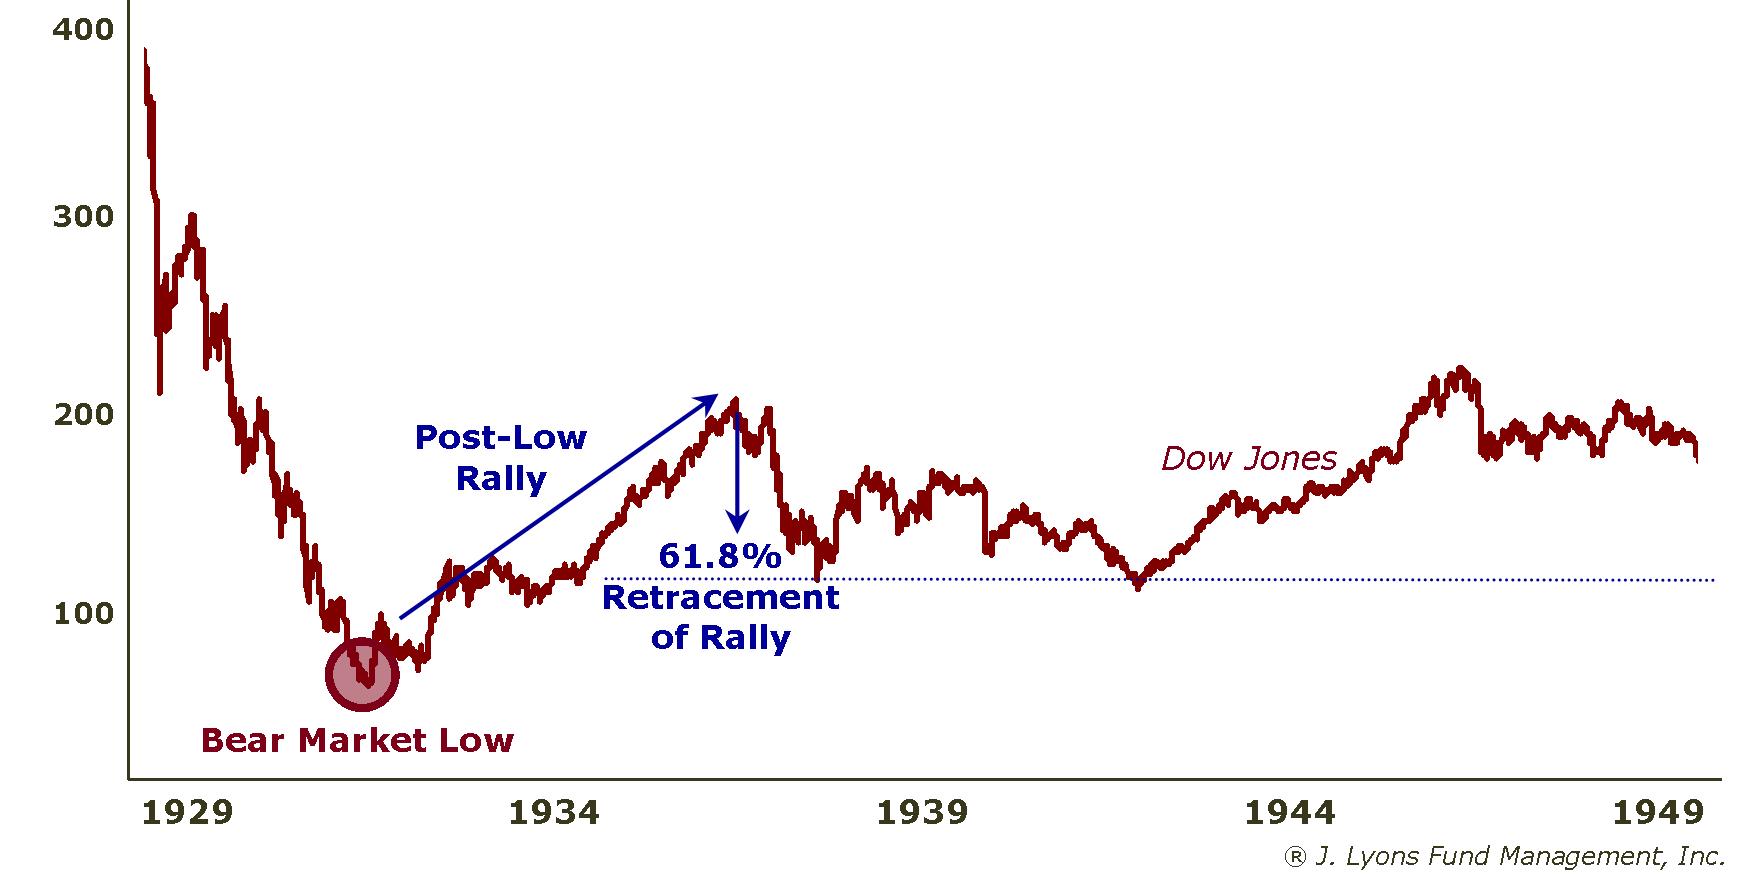
After making the low, each of the previous secular bear markets were able hold a significant level above that low for the duration of the bear market. That level is signified by a 61.8% retracement of the rally that occurred immediately following the bear market low. In other words, for the duration of the secular bear, the market essentially never lost more than 61.8% of its gains made from the bear market low to the subsequent rally peak.
After the rally from the low in 1932 to the peak in 1937, the Dow never retraced more than 61.8% of the move, twice bouncing off that approximate level in 1938 and 1942.
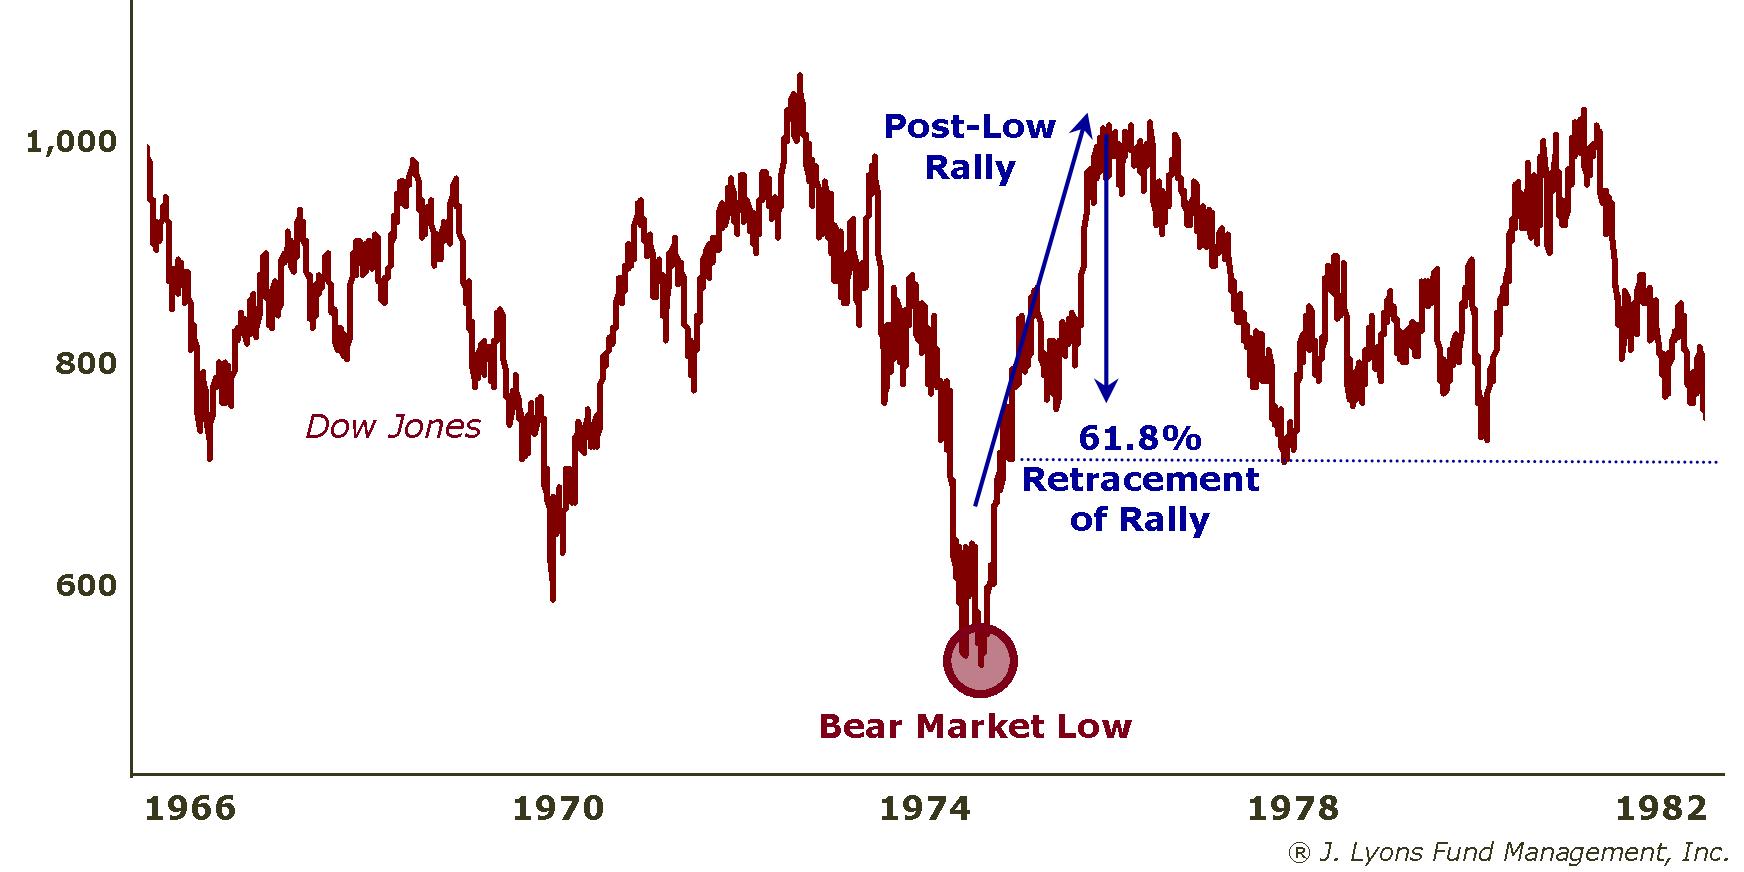
Likewise, during the last secular bear market, the Dow held the 61.8% retracement level of the rally from the secular bear low in 1974 to the subsequent rally peak in 1976. It too twice bounced off almost that exact level, in 1978 and 1980.
So what's the big deal about 61.8%? Is it just a coincidental quirk that we've data-mined from the prior secular bear markets? 61.8% is actually what's called a Fibonacci number. Fibonacci was a medieval mathematician who discovered, or at least introduced, a specific sequence of numbers, often recurring in nature and other walks of life. These number patterns are also present in financial markets and are often used when considering retracements, or counter moves, of market rallies or declines. For example, the S&P 500 low made in March 2009 was an exact 61.8% retracement of the move from the beginning of the secular bull market in August 1982 to the all-time high in 2007.
61.8% is a major Fibonacci retracement number. After a rally, it is often the last line in the sand in terms of support for market that is pulling back, or retracing, the rally. If the 61.8% retracement level is breached, a market is thought to be vulnerable to a subsequent move all the way down to its prior low. As illustrated, the market found support (i.e., held above) at the 61.8% retracement levels following the post-low rallies during the 1930s and 1970s above.
Considering our current situation, the S&P 500 rallied from a bear market low in March 2009 of 666 to a high this past May of 1370. A 61.8% retracement of that move would bring the index to around 937.
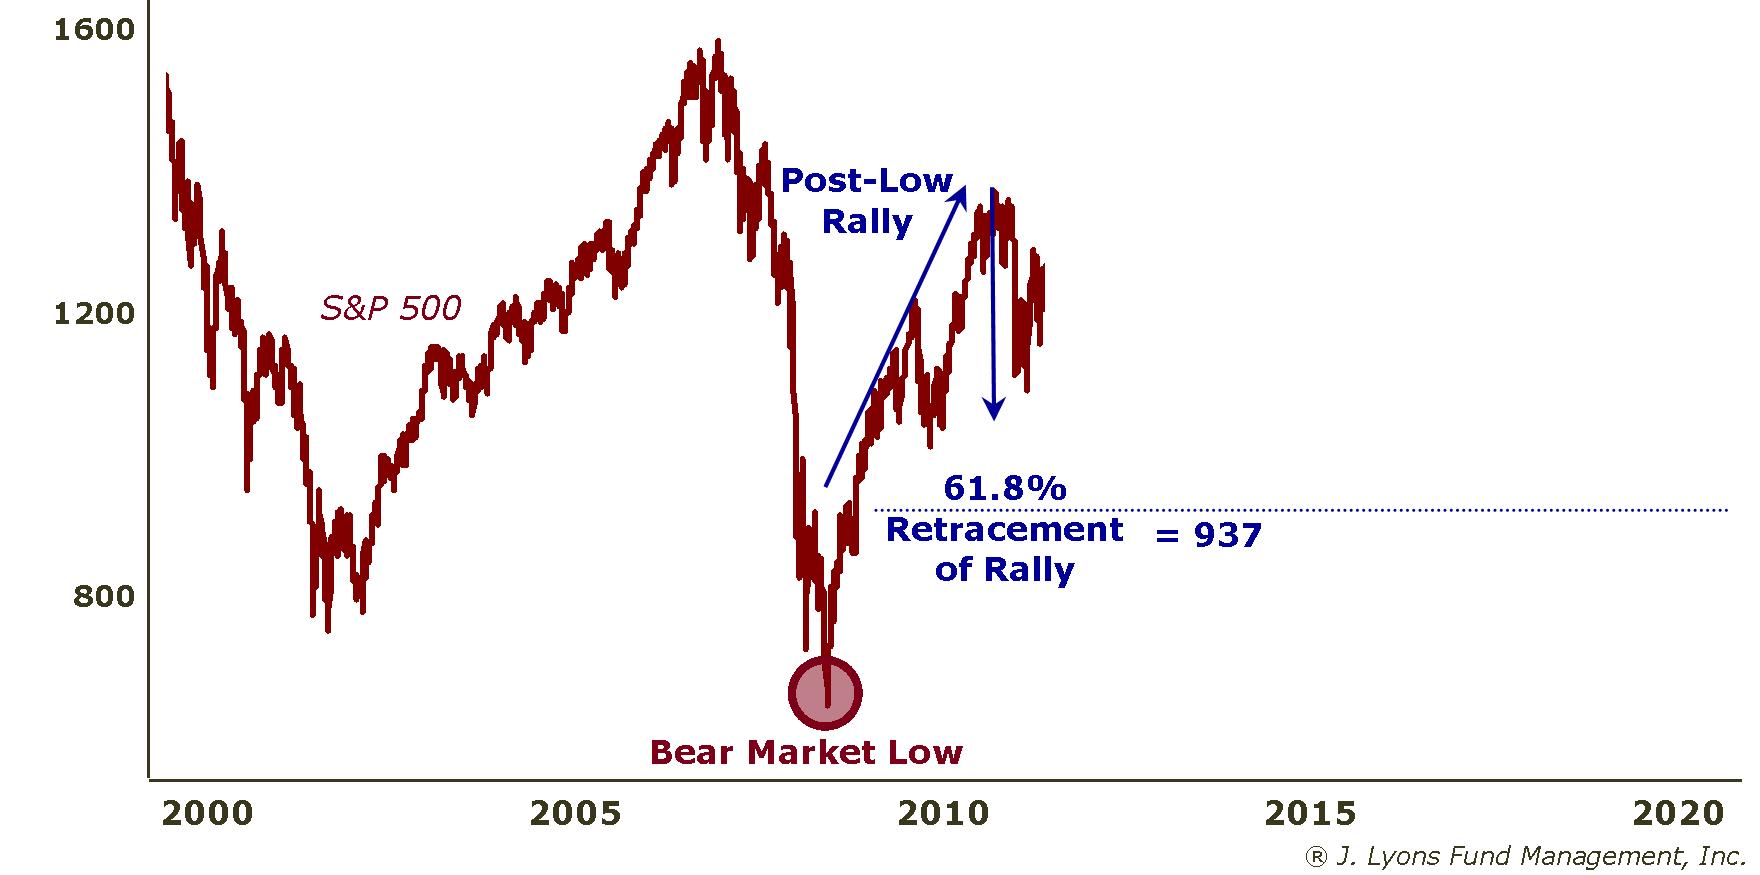
If history is any guide, that 937 level should serve as support for the rest of the secular bear market (probably 6-8 more years). That means that we should not see the S&P 500 move significantly below that level. If it does, investors should be concerned (if they are not already concerned by that point since 937 represents a 25% drop from current levels.)
This analysis is our attempt at finding the "good" news in our present scenario. In this case, it falls into the category of "glass half-full" good news, at best. Even if the market does hold the 61.8% retracement level, 1) it is still unlikely to rally on a sustainable basis over the remainder of this decade, 2) it does not guarantee the market will rally at all from present levels and 3) that still leaves the market open to 25% downside before that 937 level is reached.
Some observers have accused us of having a rather pessimistic tone to our market analysis. We prefer to be considered realistic, and generally correct during the 12-year old secular bear market. In this business, you cannot choose sides (unless one works as a sell-side "analyst" in which case they invariably choose the bullish side since they are trying to capture and retain assets in their funds, etc.) One has to keep a realistic view, and in our opinion the current investment environment continues to call for more pessimism than optimism, as it has for the past twelve years.
Conclusion
Market forecasts are an unfortunate reality of each new year. These ubiquitous 12-month predictions are not worth the paper they are printed on, except for perhaps boosting the image of the local fortune teller. We suspect that, deep down, many investors feel the same way. That is why it confounds us that so many of these same people basically invest their retirement money based on 10, 20 or 30-year forecasts.
Buying-and-holding a portfolio of stocks or funds indefinitely is essentially forecasting that these securities will be the best investments for them over the next 30 years, or however long they hold them. If a 12-month forecast seems worthless, a 30-year forecast, to us, is preposterous. Markets are constantly changing. In our view, an Active Management investment strategy is necessary to not only identify when market leaders are changing but also when the general market is at risk of serious losses and investors should not be invested at all.
Our update of the current secular bear market indicates that such a strategy continues to be as important as ever. Again, the historical comparisons above are not forecasts but merely indicate how the market would perform should it adhere to historical patterns. And while the studies suggest that the downside over the remainder of this secular bear market may be limited, we do strongly believe that the general sideways pattern will continue for several years to come.
Our only forecast is that if buy-and-hold investors do not make a strategy change, they will continue to be frustrated by a secular bear market for years to come and a nest egg that is, at best, running in place.
For a more detailed and compelling case against buying and holding stocks in this environment, see “Here Lies Buy and Hold” from the JLFMI archives.
Dana LyonsVice President
The
commentary
included in this newsletter is provided for informational purposes
only. It does not constitute a recommendation to invest in any
specific investment product or service. Proper due diligence should be
performed before
investing in any investment vehicle. There is a risk of loss involved
in
all investments.
| Tweet |
|